^ 关注我,带你一起学GIS ^
注:当前使用的是 ol [9.2.4] 版本,天地图使用的key请到天地图官网申请,并替换为自己的key
 前言
前言
❝聚类分析是指将空间上分散的点集按一定距离进行合并展示,从而达到简化数据的目的。
1. 样式类RegularShape
该类可以为矢量要素设置常规样式。当提供一个半径时,将绘制一个常规多边形;当同时提供半径1和半径2时,将绘制成星****形。在【OpenLayers 绘制几何对象】一节中,我们介绍了如何绘制几何图形,现从上面的描述中可以看出,我们又多了一种绘制星型的方式。先介绍一下RegularShape样式类的的属性选项。
名称 | 类型 | 描述 |
| Fill | undefined | 面填充样式 |
| number | 星形和多边形的点数量。对于多边形,点数量即边数量。 |
| number | 多边形的半径 |
| number | undefined | 提供第二个半径,将绘制星形而不是多边形。 |
| number (defaults to 0) | 以弧度为单位的形状角度,当值为0时,形状的一个点将朝上。 |
| Array.<number> (defaults to [0, 0]) | 以像素为单位位移形状, 正值将使形状向上向右移动。 |
| Stroke | undefined | 描边样式 |
| number (defaults to 0) | 以弧度为单位旋转,按顺时针正向旋转。 |
| boolean (defaults to false) | 形状是否跟随视图一起旋转 |
| number | Size(defaults to 1) | 比例。除非需要二维缩放,否则通过适当设置半径和半径2可以获得更好的结果。 |
| DeclutterMode | undefined | Declutter mode(稀释模式)。 |
declutter:覆盖的的符号何文本会被稀释(清理)。obstacle:符号和文本会被渲染,但会成为后续尝试将符号或文本放置在同一位置的障碍。none:无操作。
对于如何设置DeclutterMode来渲染图形和文本,不是本文关注的重点,将会在另一篇文章中讲解。当改变declutter属性值时,可以调整标注内容在不同比例尺下的显示模式。declutter值为true时,可以看到在小比例尺地图下,之前压覆的标注内容被去除了,具有更好的视觉标注效果。要查看如何标注要素请查看【OpenLayers 要素标注】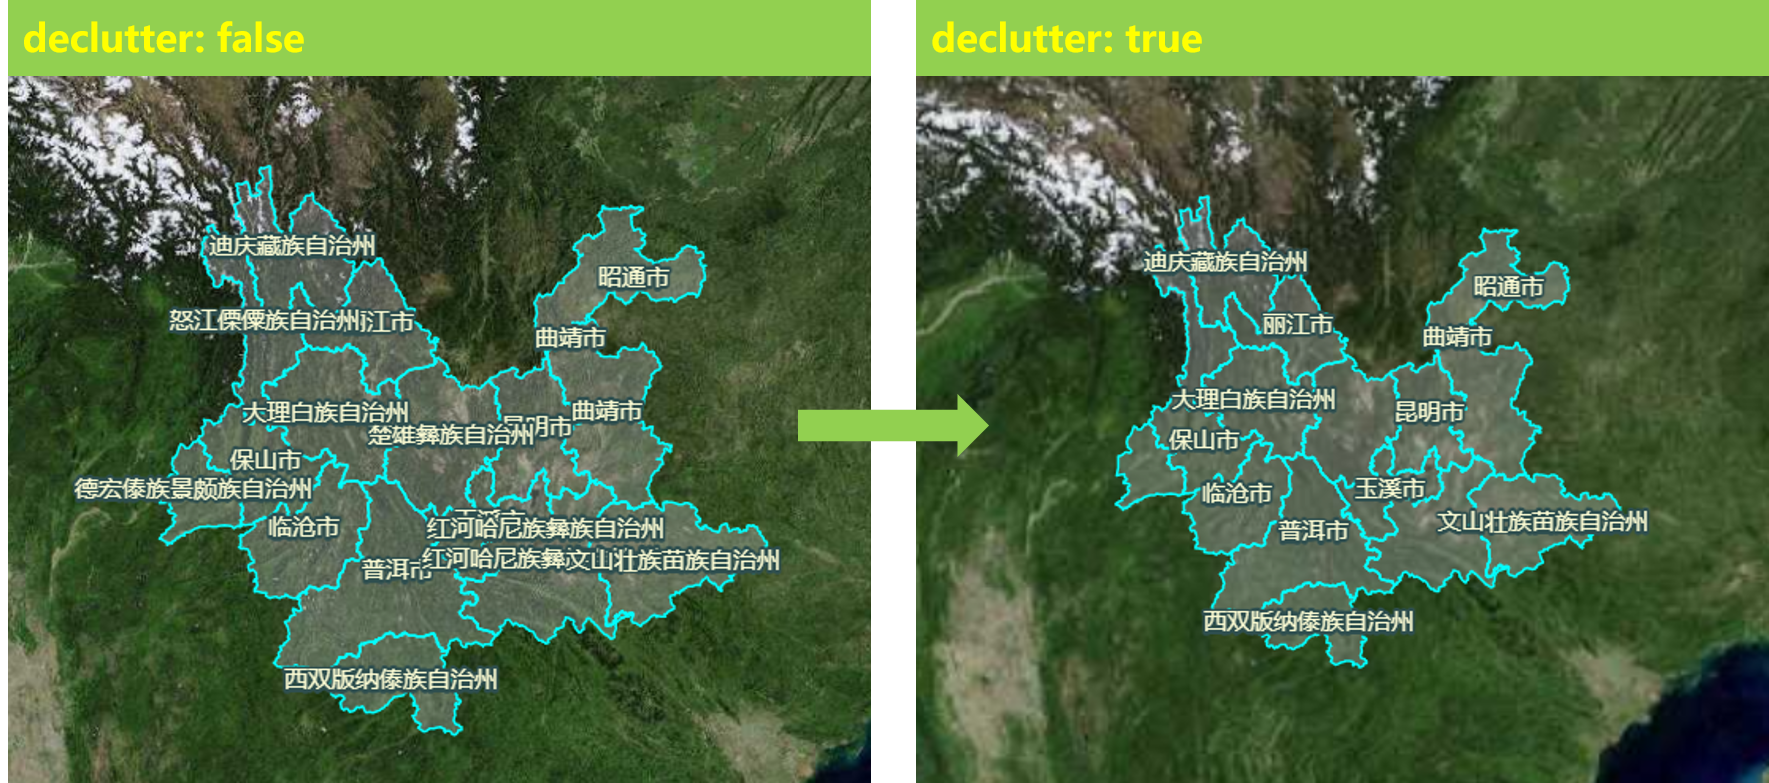
2. 聚类数据源Cluster
Cluster是对矢量数据进行聚类,属于矢量数据源。对于点状数据源可以直接使用,如果是其他的几何体类型,可以定义自定义几何函数。
名称 | 类型 | 描述 |
| AttributionLike | undefined | 数据源属性 |
| number (defaults to 20) | 要素以像素为单位的聚集距离 |
| number (defaults to 0) | 聚类之间以像素为单位的最小距离 |
| function | undefined | 聚类函数 |
| function | undefined | 聚类函数 |
| VectorSource<FeatureType> (defaults to null) | 矢量数据源 |
| boolean (defaults to true) | 是否要横向地包裹世界。 |
3. 聚类半径和样式
根据当前视图分辨率计算聚类半径
let maxFeatureCount = 0
let vectorLayer = null
// 计算聚类半径
const calculateClusterInfo = function (resolution) {
    maxFeatureCount = 0
    const features = vectorLayer.getSource().getFeatures()
    let feature, radius
    for (let i = features.length - 1; i >= 0; i--) {
        feature = features[i]
        const originalFeatures = feature.get("features")
        const extent = ol.extent.createEmpty()

        let j, jj
        for (j = 0, jj = originalFeatures.length; j < jj; ++j) {
            ol.extent.extend(extent, originalFeatures[j].getGeometry().getExtent())
        }
        maxFeatureCount = Math.max(maxFeatureCount, jj)
        radius = (0.25 * (ol.extent.getWidth(extent) + ol.extent.getHeight(extent))) / resolution
        feature.set('radius', radius)
    }
}
通过样式函数标注聚类图形。
let currentResolution
// 聚类样式
function styleFunction(feature, resolution) {
    if (resolution != currentResolution) {
        calculateClusterInfo(resolution)
        currentResolution = resolution
    }
    let style
    const size = feature.get('features').length
    // 设置聚类信息
    if (size > 1) {
        style = new ol.style.Style({
            image: new ol.style.Circle({
                radius: feature.get('radius'),
                fill: new ol.style.Fill({
                    // 聚类数量越多,透明度越低
                    color: [255, 153, 0, Math.min(0.8, 0.4 + size / maxFeatureCount)],
                })
            }),
            text: new ol.style.Text({
                text: size.toString(),
                fill: textFill,
                stroke: textStroke,
                // declutterMode: "obstacle"
            })
        })
    } else {
        // 单个地震点样式
        const originalFeature = feature.get("features")[0]
        style = createEarthquakeStyle(originalFeature)
    }
    return style
}
4. 监听鼠标事件
当鼠标在聚类图形上移动或者点击时,设置聚类图形样式。
// 鼠标事件样式
function selectStyleFunction(feature) {
    const styles = [
        new ol.style.Style({
            image: new ol.style.Circle({
                radius: feature.get('radius'),
                fill: invisibleFill
            })
        })
    ]
    const originalFeatures = feature.get("features")
    let originalFeature
    for (let i = originalFeatures.length - 1; i >= 0; --i) {
        originalFeature = originalFeatures[i]
        styles.push(createEarthquakeStyle(originalFeature))
    }
    return styles
}

// 监听鼠标事件
const selectInteraction = new ol.interaction.Select({
    condition: function (evt) {
        return evt.type === "pointermove" || evt.type === "singleclick"
    },
    style: selectStyleFunction
})
map.addInteraction(selectInteraction)
5. 监听聚类半径事件
当聚类半径发生改变时,重新设置图层样式函数。
layui.use(function () {
    const layer = layui.layer
    const slider = layui.slider;
    // 聚类距离事件
    slider.render({
        elem: '#cluster-distance',
        value: 40,
        min: 20,
        max: 100,
        step: 5,
        change: function (value) {
            // console.log(value) // 滑块当前值
            clusterSource.setDistance(value)
            vectorLayer.setStyle(styleFunction())
        }
    });
    slider.render({
        elem: '#cluster-min-distance',
        value: 10,
        min: 0,
        max: 1000,
        step: 10,
        change: function (value) {
            // console.log(value) // 滑块当前值
            clusterSource.setMinDistance(value)
            vectorLayer.setStyle(styleFunction())
        }
    });
})
6. 完整代码
其中libs文件夹下的包需要更换为自己下载的本地包或者引用在线资源。
<!DOCTYPE html>
<html>

<head>
    <meta http-equiv="Content-Type" content="text/html; charset=utf-8" />
    <title>OpenLayers 聚类分析</title>
    <meta charset="utf-8" />

    <link rel="stylesheet" href="../../libs/css/ol9.2.4.css">
    <link rel="stylesheet" href="../../libs/layui/css/layui.css">

    <script src="../../libs/js/ol9.2.4.js"></script>

    <script src="../../libs/layui/layui.js"></script>

    <script src="../../js/config.js"></script>
    <script src="../../js/util.js"></script>
    <style>
        * {
            padding: 0;
            margin: 0;
            font-size: 14px;
            font-family: '微软雅黑';
        }

        html,
        body {
            width: 100%;
            height: 100%;
        }

        #map {
            position: absolute;
            top: 50px;
            bottom: 0;
            width: 100%;
        }

        #top-content {
            position: absolute;
            width: 100%;
            height: 50px;
            line-height: 50px;
            background: linear-gradient(135deg, #ff00cc, #ffcc00, #00ffcc, #ff0066);
            color: #fff;
            text-align: center;
            font-size: 32px;
        }

        #top-content span {
            font-size: 32px;
        }

        .image-style-content {
            margin: 5px 25px;
        }

        .cluster-style {
            position: absolute;
            top: 10%;
            left: 20px;
            width: 30%;
            /* bottom: 5%; */
            background: #fff;
            border-radius: 2.5px;
            border: 1px solid #ddd;
            overflow-y: scroll;
            max-height: 80%;
        }

        .text-title {
            padding: 10px;
            margin-bottom: 15px;
            background: #16baaa;
            color: #fff;
        }

        .image-title {
            padding: 10px;
            margin-bottom: 15px;
            background: #16baaa;
            color: #fff;
        }

        .layer-prop-item {
            display: flex;
            justify-content: space-between;
            flex-direction: row;
            margin: 10px 0;
        }

        .layer-slider-item {
            width: 45%;
            margin-top: 16px;
        }

        .layui-form-label {
            width: 50%;
            padding: 8px 15px;
            height: 38px;
            line-height: 20px;
            border-width: 1px;
            border-style: solid;
            border-radius: 2px 0 0 2px;
            text-align: center;
            background-color: #fafafa;
            overflow: hidden;
            white-space: nowrap;
            text-overflow: ellipsis;
            box-sizing: border-box;
            border-color: #eee;
            font-weight: 400;
        }
    </style>
</head>

<body>
    <div id="top-content">
        <span>OpenLayers 聚类分析</span>
    </div>
    <div id="map" title=""></div>
    <div class="cluster-style">
        <h3 for="" class="image-title">聚类分析</h3>
        <div class="image-style-content">
            <div class='layer-prop-item'>
                <label class="layui-form-label">聚类距离</label>
                <div class="layer-slider-item" id="cluster-distance"></div>
            </div>
            <div class='layer-prop-item'>
                <label class="layui-form-label">最小距离</label>
                <div class="layer-slider-item" id="cluster-min-distance"></div>
            </div>
        </div>
    </div>
</body>

</html>

<script>
    //地图投影坐标系
    const projection = ol.proj.get('EPSG:3857');
    //==============================================================================//
    //============================天地图服务参数简单介绍==============================//
    //================================vec:矢量图层==================================//
    //================================img:影像图层==================================//
    //================================cva:注记图层==================================//
    //======================其中:_c表示经纬度投影,_w表示球面墨卡托投影================//
    //==============================================================================//
    const TDTImgLayer = new ol.layer.Tile({
        title: "天地图影像图层",
        source: new ol.source.XYZ({
            url: "http://t0.tianditu.com/DataServer?T=img_w&x={x}&y={y}&l={z}&tk=" + TDTTOKEN,
            attibutions: "天地图影像描述",
            crossOrigin: "anoymous",
            wrapX: true
        })
    })
    const TDTImgCvaLayer = new ol.layer.Tile({
        title: "天地图影像注记图层",
        source: new ol.source.XYZ({
            url: "http://t0.tianditu.com/DataServer?T=cia_w&x={x}&y={y}&l={z}&tk=" + TDTTOKEN,
            attibutions: "天地图注记描述",
            crossOrigin: "anoymous",
            wrapX: true
        })
    })
    const map = new ol.Map({
        target: "map",
        loadTilesWhileInteracting: true,
        view: new ol.View({
            center: [102.845864, 25.421639],
            zoom: 3,
            worldsWrap: false,
            minZoom: 1,
            maxZoom: 20,
            projection: 'EPSG:4326',
        }),
        layers: [TDTImgLayer],
        // 地图默认控件
        controls: ol.control.defaults.defaults({
            zoom: false,
            attribution: true,
            rotate: true
        })
    })

    const earthquakeFill = new ol.style.Fill({
        color: 'rgba(255, 153, 0, 0.8)',
    });
    const earthquakeStroke = new ol.style.Stroke({
        color: 'rgba(255, 204, 0, 0.2)',
        width: 1,
    });
    const textFill = new ol.style.Fill({
        color: '#fff',
    });
    const textStroke = new ol.style.Stroke({
        color: 'rgba(0, 0, 0, 0.6)',
        width: 3,
    });
    const invisibleFill = new ol.style.Fill({
        color: 'rgba(255, 255, 255, 0.01)',
    });

    // 创建地震点样式
    function createEarthquakeStyle(feature) {
        const name = feature.get("name")
        // 提取magnitude值
        const magnitude = parseFloat(name.substr(2))

        const radius = 5 + 20 * (magnitude - 5)
        return new ol.style.Style({
            geometry: feature.getGeometry(),
            image: new ol.style.RegularShape({
                radius: radius,
                radius2: 3,
                points: 5,
                angle: Math.PI,
                fill: earthquakeFill,
                stroke: earthquakeStroke
            })
        })
    }

    let maxFeatureCount = 0
    let vectorLayer = null
    // 计算聚类半径
    const calculateClusterInfo = function (resolution) {
        maxFeatureCount = 0
        const features = vectorLayer.getSource().getFeatures()
        let feature, radius
        for (let i = features.length - 1; i >= 0; i--) {
            feature = features[i]
            const originalFeatures = feature.get("features")
            const extent = ol.extent.createEmpty()

            let j, jj
            for (j = 0, jj = originalFeatures.length; j < jj; ++j) {
                ol.extent.extend(extent, originalFeatures[j].getGeometry().getExtent())
            }
            maxFeatureCount = Math.max(maxFeatureCount, jj)
            radius = (0.25 * (ol.extent.getWidth(extent) + ol.extent.getHeight(extent))) / resolution
            feature.set('radius', radius)
        }
    }

    let currentResolution
    // 聚类样式
    function styleFunction(feature, resolution) {
        if (resolution != currentResolution) {
            calculateClusterInfo(resolution)
            currentResolution = resolution
        }
        let style
        const size = feature.get('features').length
        // 设置聚类信息
        if (size > 1) {
            style = new ol.style.Style({
                image: new ol.style.Circle({
                    radius: feature.get('radius'),
                    fill: new ol.style.Fill({
                        // 聚类数量越多,透明度越低
                        color: [255, 153, 0, Math.min(0.8, 0.4 + size / maxFeatureCount)],
                    })
                }),
                text: new ol.style.Text({
                    text: size.toString(),
                    fill: textFill,
                    stroke: textStroke,
                    // declutterMode: "obstacle"
                })
            })
        } else {
            // 单个地震点样式
            const originalFeature = feature.get("features")[0]
            style = createEarthquakeStyle(originalFeature)
        }
        return style
    }

    // 鼠标事件样式
    function selectStyleFunction(feature) {
        const styles = [
            new ol.style.Style({
                image: new ol.style.Circle({
                    radius: feature.get('radius'),
                    fill: invisibleFill
                })
            })
        ]
        const originalFeatures = feature.get("features")
        let originalFeature
        for (let i = originalFeatures.length - 1; i >= 0; --i) {
            originalFeature = originalFeatures[i]
            styles.push(createEarthquakeStyle(originalFeature))
        }
        return styles
    }
    const clusterSource = new ol.source.Cluster({
        distance: 40,
        source: new ol.source.Vector({
            url: "../../data/kml/2012_Earthquakes_Mag5.kml",
            format: new ol.format.KML({
                extractStyles: false
            })
        }),
        wrapX: true,
    })
    vectorLayer = new ol.layer.Vector({
        source: clusterSource,
        // declutter: true,
        style: styleFunction
    })
    map.addLayer(vectorLayer)

    // 监听鼠标事件
    const selectInteraction = new ol.interaction.Select({
        condition: function (evt) {
            return evt.type === "pointermove" || evt.type === "singleclick"
        },
        style: selectStyleFunction
    })
    map.addInteraction(selectInteraction)

    layui.use(function () {
        const layer = layui.layer
        const slider = layui.slider;
        // 聚类距离事件
        slider.render({
            elem: '#cluster-distance',
            value: 40,
            min: 20,
            max: 100,
            step: 5,
            change: function (value) {
                // console.log(value) // 滑块当前值
                clusterSource.setDistance(value)
                vectorLayer.setStyle(styleFunction())
            }
        });
        slider.render({
            elem: '#cluster-min-distance',
            value: 10,
            min: 0,
            max: 1000,
            step: 10,
            change: function (value) {
                // console.log(value) // 滑块当前值
                clusterSource.setMinDistance(value)
                vectorLayer.setStyle(styleFunction())
            }
        });
    })
</script>
❝
OpenLayers示例数据下载,请在公众号后台回复:ol数据
全国信息化工程师-GIS 应用水平考试资料,请在公众号后台回复:GIS考试
❝
GIS之路公众号已经接入了智能助手,欢迎大家前来提问。
欢迎访问我的博客网站-长谈GIS:
http://shanhaitalk.com
都看到这了,不要忘记点赞、收藏+关注 哦!
本号不定时更新有关 GIS开发 相关内容,欢迎关注 
