^ 关注我,带你一起学GIS ^
注:当前使用的是 ol [9.2.4] 版本,天地图使用的key请到天地图官网申请,并替换为自己的key
 前言
前言
❝使用OpenLayers不仅可以绘制普通点、线、面等形状,还可以自定义绘制形状,比如可以用来绘制带箭头的线段。
1. 基本原理
绘制箭头线是在绘制普通线段的基础上进行改进,在绘制过程中需要计算下一节点与上一节点之间的方向关系,并且在下一节点的基础上添加箭头图标。在给绘制线段添加自定义样式前,可以通过样式函数来实现。
2. 创建样式函数
该样式函数具有一个参数feature,并且在最后需要返回样式对象。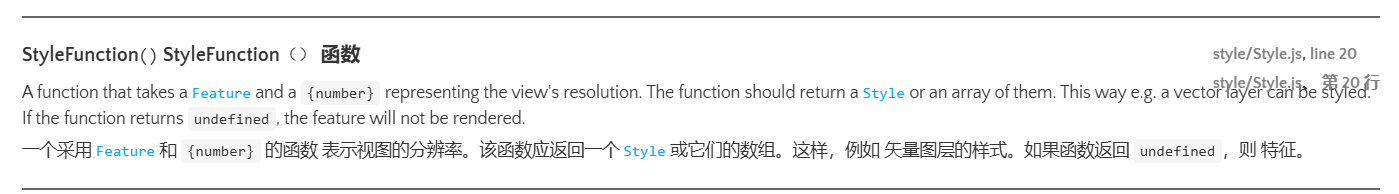 因为需要为多个绘制的节点添加箭头,所以创建一个线段样式数组用来保存箭头线。
Math.atan2(p1,p2)方法计算二维坐标系中任意一个点(x, y)和原点(0, 0)的连线与X轴正半轴的夹角大小。
此处可以使用该函数来计算下一节点与上一节点之间的方向。对于需要添加的箭头可以使用图标样式来实现,在网上下载一个右箭头图标即可。这里推荐使用阿里巴巴矢量图标库。iconfont:[https://www.iconfont.cn/](https://www.iconfont.cn/)。对于如何设置要素样式,可以参考样式大全
// 创建样式函数
const styleFunction = function (feature) {
    const geometry = feature.getGeometry()
    const lineStyles = [
        new ol.style.Style({
            stroke: new ol.style.Stroke({
                color: "#1296db",
                width: 5
            })
        })
    ]
    geometry.forEachSegment((start, end) => {
        const dx = end[0] - start[0]
        const dy = end[1] - start[1]
        const rotation = Math.atan2(dy, dx)
        lineStyles.push(new ol.style.Style({
            geometry: new ol.geom.Point(end),
            image: new ol.style.Icon({
                src: "../../image/arrow-right.png",
                anchor: [0.85, 0.5],
                rotationWithView: true,
                rotation: -rotation
            })
        }))
    })
    // 记住需要返回样式数组
    return lineStyles
}
3. 创建矢量图层
后面的就比较简单了,只需要创建矢量数据源,然后将其放在矢量图层中。最后创建绘制交互控件,并将其添加到地图中即可。
// 创建矢量数据源
const vectorSource = new ol.source.Vector({})
// 创建矢量图层
const vectorLayer = new ol.layer.Vector({
    source: vectorSource,
    style: styleFunction
})
// 添加矢量图层
map.addLayer(vectorLayer)

// 创建绘制控件
const drawInteraction = new ol.interaction.Draw({
    source: vectorSource,
    type: "LineString"
})
// 添加绘制控件
map.addInteraction(drawInteraction)
4. 完整代码
其中libs文件夹下的包需要更换为自己下载的本地包或者引用在线资源。
<!DOCTYPE html>
<html>

<head>
    <meta http-equiv="Content-Type" content="text/html; charset=utf-8" />
    <title>OpenLayers 绘制箭头线</title>
    <meta charset="utf-8" />

    <link rel="stylesheet" href="../../libs/css/ol9.2.4.css">

    <script src="../../js/config.js"></script>
    <script src="../../libs/js/ol9.2.4.js"></script>
    <style>
        * {
            padding: 0;
            margin: 0;
            font-size: 14px;
            font-family: '微软雅黑';
        }

        html,
        body {
            width: 100%;
            height: 100%;
        }

        #map {
            position: absolute;
            top: 50px;
            bottom: 0;
            width: 100%;
            background: #E0ECED;
        }

        #top-content {
            position: absolute;
            width: 100%;
            height: 50px;
            line-height: 50px;
            background: linear-gradient(135deg, #ff00cc, #ffcc00, #00ffcc, #ff0066);
            color: #fff;
            text-align: center;
            font-size: 32px;
        }

        #top-content span {
            font-size: 32px;
        }
    </style>
</head>

<body>
    <div id="top-content">
        <span class="removeAllLayer">OpenLayers 绘制箭头线</span>
    </div>

    <div id="map"></div>
</body>

</html>
<script>
    //地图投影坐标系
    const projection = ol.proj.get('EPSG:3857');
    //==============================================================================//
    //============================天地图服务参数简单介绍==============================//
    //================================vec:矢量图层==================================//
    //================================img:影像图层==================================//
    //================================cva:注记图层==================================//
    //======================其中:_c表示经纬度投影,_w表示球面墨卡托投影================//
    //==============================================================================//
    const TDTImgLayer = new ol.layer.Tile({
        title: "天地图影像图层",
        source: new ol.source.XYZ({
            url: "http://t0.tianditu.com/DataServer?T=img_w&x={x}&y={y}&l={z}&tk=" + TDTTOKEN,
            attibutions: "天地图影像描述",
            crossOrigin: "anoymous",
            wrapX: false
        })
    })
    const TDTImgCvaLayer = new ol.layer.Tile({
        title: "天地图影像注记图层",
        source: new ol.source.XYZ({
            url: "http://t0.tianditu.com/DataServer?T=cia_w&x={x}&y={y}&l={z}&tk=" + TDTTOKEN,
            attibutions: "天地图注记描述",
            crossOrigin: "anoymous",
            wrapX: false
        })
    })

    const map = new ol.Map({
        target: "map",
        loadTilesWhileInteracting: true,
        view: new ol.View({
            center: [101.485106, 25.008643],
            zoom: 5,
            worldsWrap: false,
            minZoom: 1,
            maxZoom: 20,
            projection: 'EPSG:4326',
        }),
        layers: [TDTImgLayer],
        // 地图默认控件
        controls: ol.control.defaults.defaults({
            zoom: false,
            attribution: true,
            rotate: true
        })
    })
    // 创建样式函数
    const styleFunction = function (feature) {
        const geometry = feature.getGeometry()
        const lineStyles = [
            new ol.style.Style({
                stroke: new ol.style.Stroke({
                    color: "#1296db",
                    width: 5
                })
            })
        ]
        geometry.forEachSegment((start, end) => {
            const dx = end[0] - start[0]
            const dy = end[1] - start[1]
            const rotation = Math.atan2(dy, dx)
            lineStyles.push(new ol.style.Style({
                geometry: new ol.geom.Point(end),
                image: new ol.style.Icon({
                    src: "../../image/arrow-right.png",
                    anchor: [0.85, 0.5],
                    rotationWithView: true,
                    rotation: -rotation
                })
            }))
        })
        // 记住需要返回样式数组
        return lineStyles
    }
    // 创建矢量数据源
    const vectorSource = new ol.source.Vector({})
    // 创建矢量图层
    const vectorLayer = new ol.layer.Vector({
        source: vectorSource,
        style: styleFunction
    })
    // 添加矢量图层
    map.addLayer(vectorLayer)

    // 创建绘制控件
    const drawInteraction = new ol.interaction.Draw({
        source: vectorSource,
        type: "LineString"
    })
    // 添加绘制控件
    map.addInteraction(drawInteraction)
</script>
如果你喜欢本文的话,可以点赞、收藏哦 !也可以关注我的微信公众号,不定时更新有关WebGIS开发相关内容。
❝
OpenLayers示例数据下载,请在公众号后台回复:ol数据
全国信息化工程师-GIS 应用水平考试资料,请在公众号后台回复:GIS考试
❝
GIS之路公众号已经接入了智能助手,欢迎大家前来提问。
欢迎访问我的博客网站-长谈GIS:
http://shanhaitalk.com
都看到这了,不要忘记点赞、收藏+关注 哦!
本号不定时更新有关 GIS开发 相关内容,欢迎关注 
