^ 关注我,带你一起学GIS ^
注:当前使用的是 ol [9.2.4] 版本,天地图使用的key请到天地图官网申请,并替换为自己的key
 前言
前言
❝在GIS开发中,使用OpenLayers 模拟海平面上升的视觉效果。通过动态调整海平面高度,用户可以直观地看到哪些地区可能受到海平面上升的威胁,从而更好地理解和评估环境风险。使用 MapTiler Terrain-RGB tiles 瓦片和ol/source/Raster数据源,开发者可以模拟不同海拔高度下的海平面变化,直观地展示海平面上升对地理环境的潜在影响。
本文来源于OpenLayers官方例子,详情可参考官网:https://openlayers.org/en/v9.2.4/examples/sea-level.html
1. 前期准备
例子使用maptiler地图切片服务和地形服务数据进行展示,在进行地图开发前,如果还没有地图开发的key值,需要到maptiler官网申请key。
官网地址:https://cloud.maptiler.com如果之前未注册过账号,可以选择使用邮箱登录或谷歌账号登录,进入官网后,填写一些基本信息,进入到产品界面,如下图点击**[API Keys]**就可以看到自己的key值。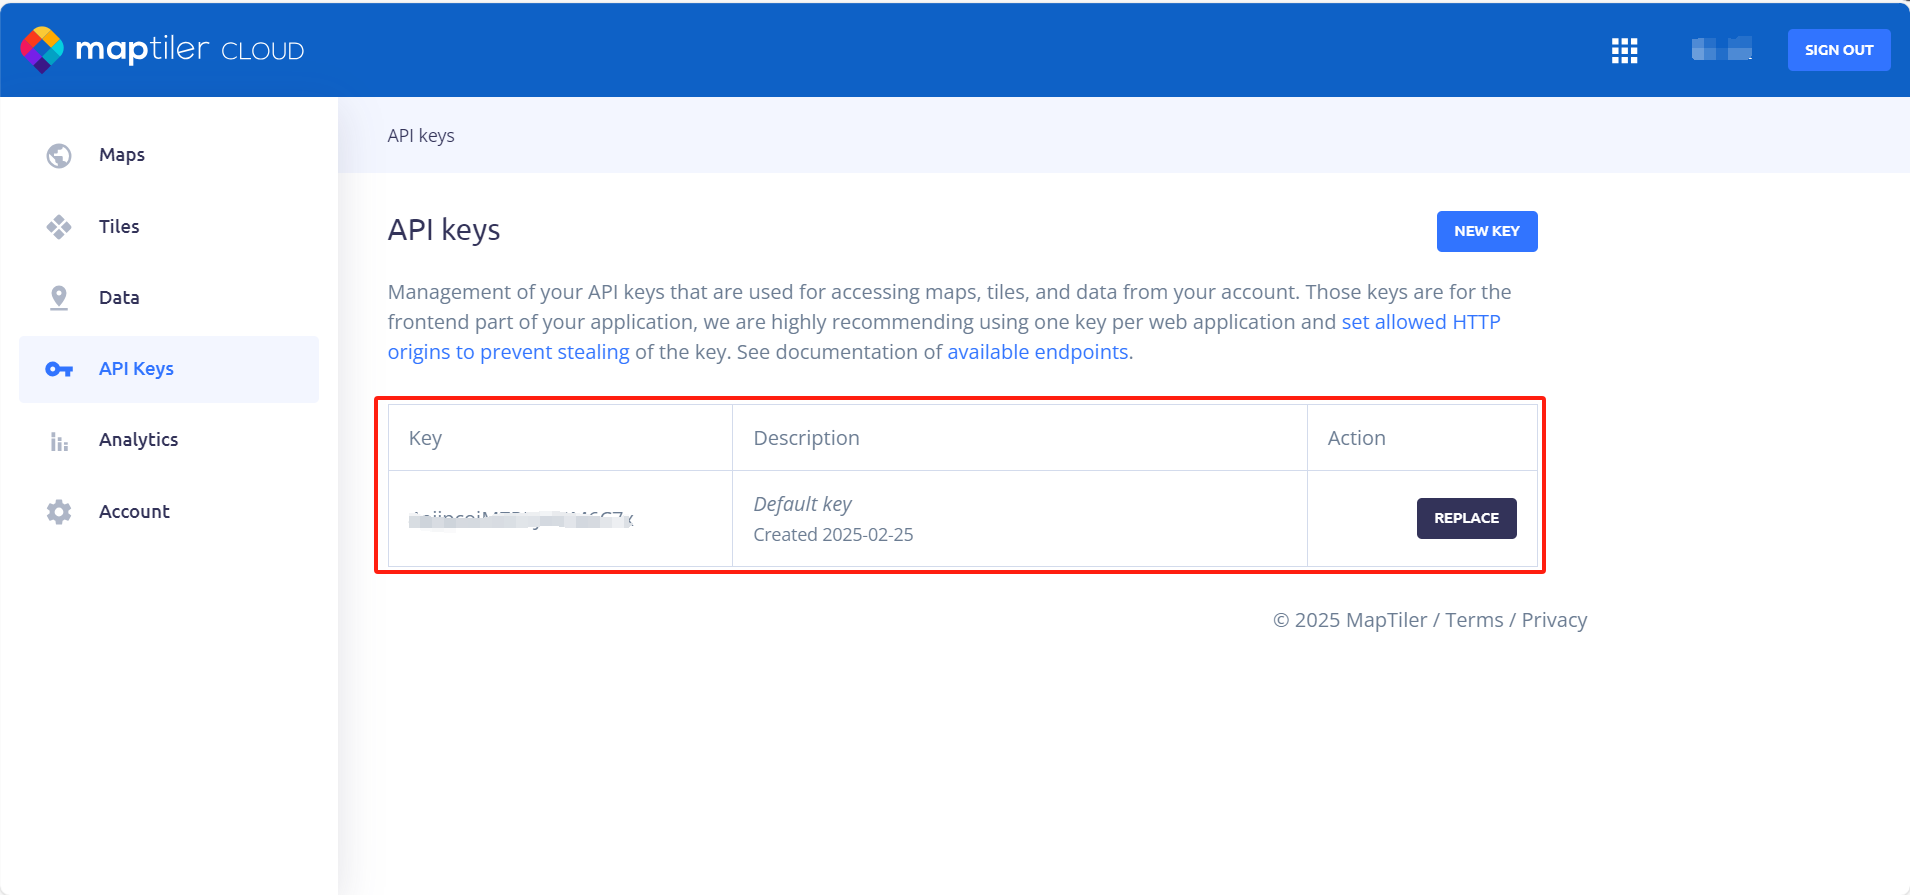
2. 地图坐标
在使用洪水淹没分析时,应将地图坐标系改为投影坐标系,如例子中使用的是墨卡托投影坐标系。如果使用地理坐标系则无法正常显示洪水淹没效果。
view: new ol.View({
    center: ol.proj.fromLonLat([120.831, 31.160]),
    zoom: 8,
    worldsWrap: false,
    minZoom: 1,
    maxZoom: 20,
    projection: 'EPSG:3857',
})
3. 洪水淹没函数
flood 函数的作用是根据像素的高程数据(海拔高度)和海平面高度(data.level),判断某个区域是否会被海水淹没,并将淹没区域用特定的颜色(浅蓝色)标记出来。未被淹没的区域则会被设置为透明。这个函数通常用于 地图可视化,特别是在模拟海平面上升、洪水淹没等场景中。它可以处理像素数据,动态生成淹没效果。
// 模拟洪水淹没
function flood(pixels, data) {
    const pixel = pixels[0]
    if (pixel[3]) {
        const height = -10000 + (pixel[0] * 256 * 256 + pixel[1] * 256 + pixel[2]) * 0.1;
        if (height <= data.level) {
            pixel[0] = 134
            pixel[1] = 203
            pixel[2] = 249
            pixel[3] = 255
        } else {
            pixel[3] = 0
        }
    }
    return pixel
}
4. 添加底图和高程服务
使用ol.source.XYZ切片数据源创建maptiler高程数据源,然后将其添加到ol.source.Raster栅格数据源中。创建完成底图服务和影像图层后将其添加到地图对象中。
// 高程数据
const elevation = new ol.source.XYZ({
    url: 'https://api.maptiler.com/tiles/terrain-rgb-v2/{z}/{x}/{y}.webp?key=' + maptilerKey,
    tileSize: 512,
    maxZoom: 14,
    crossOrigin: "",
    interpolate: false
})
// 栅格图层
const raster = new ol.source.Raster({
    sources: [elevation],
    operation: flood
})

// maptiler地图服务
const maptilerLayer = new ol.layer.Tile({
    source: new ol.source.XYZ({
        url: 'https://api.maptiler.com/maps/streets-v2/{z}/{x}/{y}.png?key=' + maptilerKey,
        tileSize: 512,
        maxZoom: 22,
    })
})
// 高程服务
const imageLayer = new ol.layer.Image({
    source: raster,
    opacity: 0.6
})
map.addLayer(maptilerLayer)
map.addLayer(imageLayer)
5. 洪水淹没分析
使用滑动条更改高程值,在地图上进行洪水淹没动态分析,并显示高程值,可以看到淹没范围随着高程值得改变而动态变化。
// 监听高程值变化
const seaChange = document.querySelector(".sea-input")
// 更新显示高程值
const seaOutput = document.querySelector(".sea-output")

seaChange.addEventListener("input", (evt => {
    seaOutput.innerText = seaChange.value
    raster.changed()
}))

seaOutput.innerText = seaChange.value
raster.on("beforeoperations", event => {
    event.data.level = seaChange.value
})
6. 完整代码
其中libs文件夹下的包需要更换为自己下载的本地包或者引用在线资源。
<!DOCTYPE html>
<html>

<head>
    <meta http-equiv="Content-Type" content="text/html; charset=utf-8" />
    <title>OpenLayers 模拟海平面上升的视觉效果</title>
    <meta charset="utf-8" />

    <link rel="stylesheet" href="../../libs/css/ol9.2.4.css">

    <script src="../../js/config.js"></script>
    <script src="../../libs/js/ol9.2.4.js"></script>
    <style>
        * {
            padding: 0;
            margin: 0;
            font-size: 14px;
            font-family: '微软雅黑';
        }

        html,
        body {
            width: 100%;
            height: 100%;
        }

        #map {
            position: absolute;
            top: 50px;
            bottom: 0;
            width: 100%;
        }

        #top-content {
            position: absolute;
            width: 100%;
            height: 50px;
            line-height: 50px;
            background: linear-gradient(135deg, #ff00cc, #ffcc00, #00ffcc, #ff0066);
            color: #fff;
            text-align: center;
            font-size: 32px;
        }

        #top-content span {
            font-size: 32px;
        }

        .state {
            position: absolute;
            bottom: 10px;
            line-height: 30px;
            background: linear-gradient(135deg, #ff00cc, #ffcc00, #00ffcc, #ff0066);
            color: #fff;
            display: flex;
            height: 30px;
            width: 25%;
            left: 50%;
            transform: translateX(-50%);
            border-radius: 5px;
        }

        .state-item {
            width: 50%;
            text-align: center;
            font-size: 16px;
            font-weight: bold;
        }

        .sea-input {
            vertical-align: text-bottom;
        }

        .sea-output {
            display: inline-block;
            width: 30px;
        }

        .location-item {
            text-align: left;
        }
    </style>
</head>

<body>
    <div id="top-content">
        <span>OpenLayers 模拟海平面上升的视觉效果</span>
    </div>
    <div id="map" title=""></div>
    <div class="state">
        <div class="state-item">
            <label for="">海拔:</label>
            <input class="sea-input" type="range" value="1" min="0" max="100" step="1"></input>
        </div>
        <div class="state-item location-item">
            +<label for="" class="sea-output"></label>m
            <label class="location">当前定位:上海</label>
        </div>
    </div>
</body>

</html>

<script>
    const map = new ol.Map({
        target: "map",
        loadTilesWhileInteracting: true,
        view: new ol.View({
            center: ol.proj.fromLonLat([120.831, 31.160]),
            zoom: 8,
            worldsWrap: false,
            minZoom: 1,
            maxZoom: 20,
            projection: 'EPSG:3857',
        }),
        layers: [],
        // 地图默认控件
        controls: ol.control.defaults.defaults({
            zoom: false,
            attribution: true,
            rotate: true
        })
    })

    // 模拟洪水淹没
    function flood(pixels, data) {
        const pixel = pixels[0]
        if (pixel[3]) {
            const height = -10000 + (pixel[0] * 256 * 256 + pixel[1] * 256 + pixel[2]) * 0.1;
            if (height <= data.level) {
                pixel[0] = 134
                pixel[1] = 203
                pixel[2] = 249
                pixel[3] = 255
            } else {
                pixel[3] = 0
            }
        }
        return pixel
    }

    // 高程数据
    const elevation = new ol.source.XYZ({
        url: 'https://api.maptiler.com/tiles/terrain-rgb-v2/{z}/{x}/{y}.webp?key=' + maptilerKey,
        tileSize: 512,
        maxZoom: 14,
        crossOrigin: "",
        interpolate: false
    })
    // 栅格图层
    const raster = new ol.source.Raster({
        sources: [elevation],
        operation: flood
    })

    // maptiler地图服务
    const maptilerLayer = new ol.layer.Tile({
        source: new ol.source.XYZ({
            url: 'https://api.maptiler.com/maps/streets-v2/{z}/{x}/{y}.png?key=' + maptilerKey,
            tileSize: 512,
            maxZoom: 22,
        })
    })

    const imageLayer = new ol.layer.Image({
        source: raster,
        opacity: 0.6
    })
    map.addLayer(maptilerLayer)
    map.addLayer(imageLayer)

    // 监听高程值变化
    const seaChange = document.querySelector(".sea-input")
    // 更新显示高程值
    const seaOutput = document.querySelector(".sea-output")

    seaChange.addEventListener("input", (evt => {
        seaOutput.innerText = seaChange.value
        raster.changed()
    }))

    seaOutput.innerText = seaChange.value
    raster.on("beforeoperations", event => {
        event.data.level = seaChange.value
    })

</script>
❝
OpenLayers示例数据下载,请在公众号后台回复:ol数据
全国信息化工程师-GIS 应用水平考试资料,请在公众号后台回复:GIS考试
❝
GIS之路公众号已经接入了智能助手,欢迎大家前来提问。
欢迎访问我的博客网站-长谈GIS:
http://shanhaitalk.com
都看到这了,不要忘记点赞、收藏+关注 哦!
本号不定时更新有关 GIS开发 相关内容,欢迎关注 
