^ 关注我,带你一起学GIS ^
注:当前使用的是 ol [9.2.4] 版本,天地图使用的key请到天地图官网申请,并替换为自己的key
 前言
前言
❝在GIS开发中,节点捕捉是一种基础且常见的功能。节点捕捉是指在地图绘制或者编辑过程中,将点、线、面几何对象对象自动对齐到其他要素的节点、端点或边界的操作。节点捕捉在图形绘制、编辑以及拓扑检查中具有广泛应用,是GIS数据处理的基础工具。
在本例子中以加载云南省GoeJSON数据为例,对如何使用OpenLayers实现节点捕捉功能进行讲解。
1. 创建标注样式
首先对云南省行政区数据设置半透明填充和描边样式,然后对标注文本设置填充和描边样式。defaultFillColor为默认填充色,在要素不需要高亮显示后恢复为初始填充色时使用。
// 文字样式
const labelStyle = new ol.style.Style({
    text: new ol.style.Text({
        font: '12px Calibri,sans-serif',
        overflow: true,
        // 填充色
        fill: new ol.style.Fill({
            color: "#FAFAD2"
        }),
        // 描边色
        stroke: new ol.style.Stroke({
            color: "#2F4F4F",
            width: 3,
        })
    })
})
// 要素样式
const defaultFillColor = [230, 230, 250, 0.25]
const regionStyle = new ol.style.Style({
    fill: new ol.style.Fill({
        color: defaultFillColor,
    }),
    stroke: new ol.style.Stroke({
        color: "#00FFFF",
        width: 1.25,
    }),
})
在以上代码中分别创建了图层渲染样式以及文本标注样式,在OpenLayers中使用Style对象管理样式,Fill对象设置要素填充颜色,Stroke对象设置描边(边线)样式,Text对象用于设置文本样式。
在以下代码中创建的是绘制样式,与前面的图层样式一致,可以为绘制图层和绘制对象添加渲染样式。
// 绘制样式
const drawStyle = new ol.style.Style({
    fill: new ol.style.Fill({
        color: [255, 233, 150, 0.15]
    }),
    stroke: new ol.style.Stroke({
        color: [255, 233, 150],
        width: 1.25
    }),
    // 绘制鼠标跟随样式
    image: new ol.style.Circle({
        radius: 5,
        fill: new ol.style.Fill({
            color: [255, 233, 150, 0.65]
        }),
        stroke: new ol.style.Stroke({
            color: [249, 198, 8],
            width: 1.25
        }),
    })
})
其中样式属性image用于在进行图形绘制时,设置鼠标指针的圆形样式,该样式使用Circle类实现。若在绘制时不想显示该圆形要素,可以不设置image属性。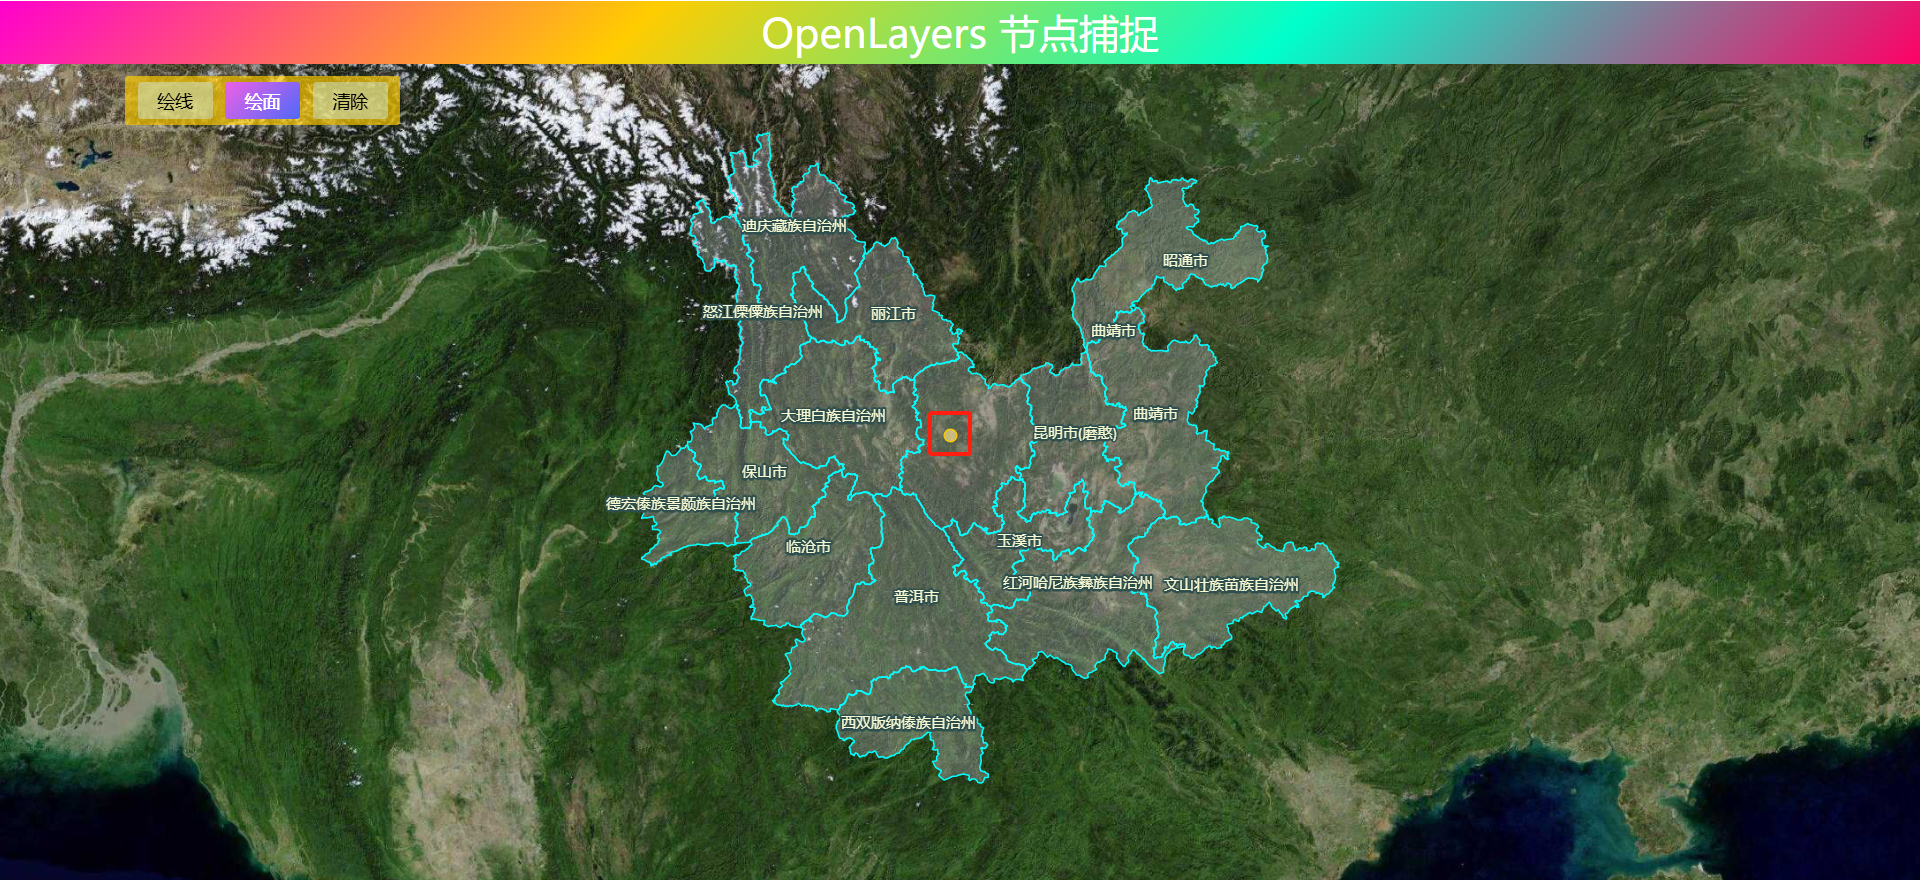
2. 创建交互控件
创建绘制图层对象,使用绘制样式进行渲染。使用set方法为绘制图层对象添加"layerName"属性,设置其之为"tempLayer",用于根据图层名移除目标图层。
// 添加绘制图层
drawLayer = new ol.layer.Vector({
    source: new ol.source.Vector(),
    style: drawStyle
})
drawLayer.set("layerName", "tempLayer")
map.addLayer(drawLayer)
创建节点捕捉控件,只需要在Snap交互控件中设置捕捉数据源。
// 节点捕捉控件
snapInteraction = new ol.interaction.Snap({
    source: regionLayer.getSource()
})
Snap对象属性不多,捕捉要素集features和捕捉数据源source两者必须要提供其中一个。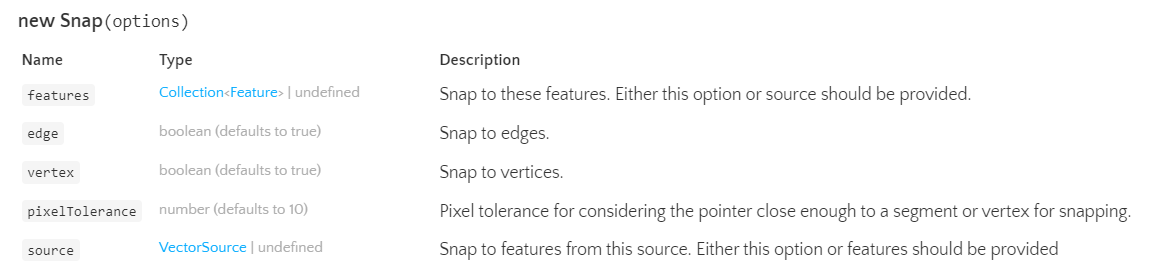
创建绘制控件,在Draw交互对象中需要设置绘制数据源对象、绘制对象类型,并设置绘制样式。trace属性用于设置是否开启节点捕捉;traceSource属性用于设置在绘制过程中进行捕捉的数据源对象。
// 绘制交互控件
drawInteraction = new ol.interaction.Draw({
    source: drawLayer.getSource(),
    style: drawStyle,
    type: drawType,
    trace: true,  // 开启节点捕捉
    traceSource: regionLayer.getSource() // 节点捕捉数据源
})
map.addInteraction(drawInteraction)
map.addInteraction(snapInteraction)
将以上对象抽取汇集到addInteraction方法中如下。
// 添加交互控件
function addInteraction(type) {
    // 添加绘制图层
    drawLayer = new ol.layer.Vector({
        source: new ol.source.Vector(),
        style: drawStyle
    })
    drawLayer.set("layerName", "tempLayer")
    map.addLayer(drawLayer)

    switch (type) {
        case "line":
            drawType = "LineString"
            break
        case "polygon":
            drawType = "Polygon"
            break
    }
    // 节点捕捉控件
    snapInteraction = new ol.interaction.Snap({
        source: regionLayer.getSource()
    })
    // 绘制交互控件
    drawInteraction = new ol.interaction.Draw({
        source: drawLayer.getSource(),
        style: drawStyle,
        type: drawType,
        trace: true,  // 开启节点捕捉
        traceSource: regionLayer.getSource() // 节点捕捉数据源
    })
    map.addInteraction(drawInteraction)
    map.addInteraction(snapInteraction)
}
3. 节点捕捉效果
在开始绘制时,在捕捉要素边缘上点击一下开始进行捕捉绘制,再次点击地图或者移动地图将关闭捕捉绘制。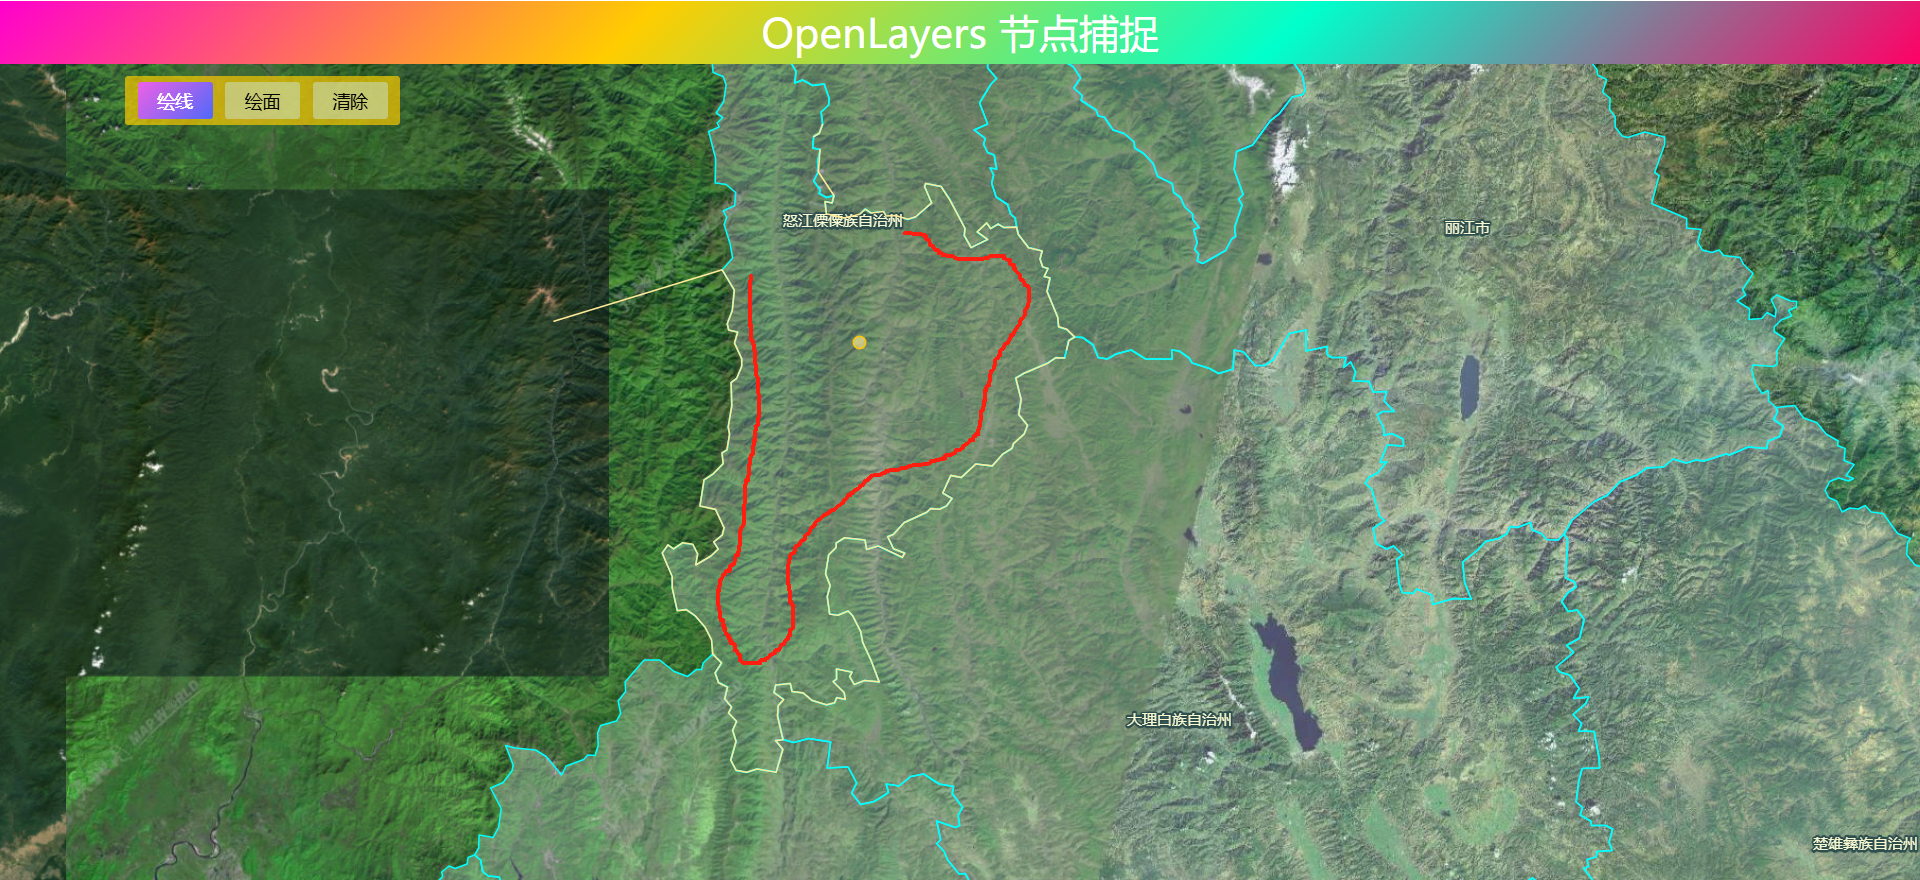
4. 完整代码
其中libs文件夹下的包需要更换为自己下载的本地包或者引用在线资源。
<!DOCTYPE html>
<html>

<head>
    <meta http-equiv="Content-Type" content="text/html; charset=utf-8" />
    <title>OpenLayers 节点捕捉</title>
    <meta charset="utf-8" />

    <link rel="stylesheet" href="../../libs/css/ol9.2.4.css">

    <script src="../../js/config.js"></script>
    <script src="../../js/util.js"></script>
    <script src="../../libs/js/ol9.2.4.js"></script>
    <style>
        * {
            padding: 0;
            margin: 0;
            font-size: 14px;
            font-family: '微软雅黑';
        }

        html,
        body {
            width: 100%;
            height: 100%;
        }

        #map {
            position: absolute;
            top: 50px;
            bottom: 0;
            width: 100%;
        }

        #top-content {
            position: absolute;
            width: 100%;
            height: 50px;
            line-height: 50px;
            background: linear-gradient(135deg, #ff00cc, #ffcc00, #00ffcc, #ff0066);
            color: #fff;
            text-align: center;
            font-size: 32px;
        }

        #top-content span {
            font-size: 32px;
        }

        .main-container {
            position: absolute;
            padding: 5px;
            top: 60px;
            left: 100px;
            background-color: #ffcc00ad;
            border-radius: 2.5px;
        }

        .main-ul {
            list-style-type: none;
        }

        .main-ul::after {
            display: block;
            clear: both;
            content: "";
        }

        .main-li {
            float: left;
            padding: 5px;
            margin: 0 5px;
            min-width: 50px;
            background-color: azure;
            background: #cae4cf82;
            transition: background-color 10s ease-in-out 10s;
            text-align: center;
            border-radius: 2.5px;
        }

        .main-li:hover {
            cursor: pointer;
            color: #fff;
            filter: brightness(110%);
            background: linear-gradient(135deg, #c850c0, #4158d0);
        }

        .active {
            background: linear-gradient(135deg, #c850c0, #4158d0);
            color: #fff;
            filter: brightness(120%);
        }
    </style>
</head>

<body>
    <div id="top-content">
        <span>OpenLayers 节点捕捉</span>
    </div>
    <div id="map" title=""></div>
    <div class="main-container">
        <ul class="main-ul">
            <li class="main-li" data-type="line">绘线</li>
            <li class="main-li" data-type="polygon">绘面</li>
            <li class="main-li" data-type="none">清除</li>
        </ul>
    </div>
</body>

</html>

<script>
    //==============================================================================//
    //============================天地图服务参数简单介绍==============================//
    //================================vec:矢量图层==================================//
    //================================img:影像图层==================================//
    //================================cva:注记图层==================================//
    //======================其中:_c表示经纬度投影,_w表示球面墨卡托投影================//
    //==============================================================================//
    const TDTImgLayer = new ol.layer.Tile({
        title: "天地图影像图层",
        source: new ol.source.XYZ({
            url: "http://t0.tianditu.com/DataServer?T=img_w&x={x}&y={y}&l={z}&tk=" + TDTTOKEN,
            attibutions: "天地图影像描述",
            crossOrigin: "anoymous",
            wrapX: false
        })
    })
    const TDTImgCvaLayer = new ol.layer.Tile({
        title: "天地图影像注记图层",
        source: new ol.source.XYZ({
            url: "http://t0.tianditu.com/DataServer?T=cia_w&x={x}&y={y}&l={z}&tk=" + TDTTOKEN,
            attibutions: "天地图注记描述",
            crossOrigin: "anoymous",
            wrapX: false
        })
    })
    const map = new ol.Map({
        target: "map",
        loadTilesWhileInteracting: true,
        view: new ol.View({
            center: [102.845864, 25.421639],
            zoom: 8,
            worldsWrap: false,
            minZoom: 1,
            maxZoom: 20,
            projection: 'EPSG:4326',
        }),
        layers: [TDTImgLayer],
        // 地图默认控件
        controls: ol.control.defaults.defaults({
            zoom: false,
            attribution: false,
            rotate: false
        })
    })

    // 文本标注样式
    const labelStyle = new ol.style.Style({
        text: new ol.style.Text({
            font: '12px Calibri,sans-serif',
            overflow: true,
            // 填充色
            fill: new ol.style.Fill({
                color: "#FAFAD2"
            }),
            // 描边色
            stroke: new ol.style.Stroke({
                color: "#2F4F4F",
                width: 3,
            }),
        })
    })
    // 要素样式
    const defaultFillColor = [230, 230, 250, 0.25]
    const regionStyle = new ol.style.Style({
        fill: new ol.style.Fill({
            color: defaultFillColor,
        }),
        stroke: new ol.style.Stroke({
            color: "#00FFFF",
            width: 1.25,
        }),
    })

    // 绘制样式
    const drawStyle = new ol.style.Style({
        fill: new ol.style.Fill({
            color: [255, 233, 150, 0.15]
        }),
        stroke: new ol.style.Stroke({
            color: [255, 233, 150],
            width: 1.25
        }),
        // 绘制鼠标跟随样式
        image: new ol.style.Circle({
            radius: 5,
            fill: new ol.style.Fill({
                color: [255, 233, 150, 0.65]
            }),
            stroke: new ol.style.Stroke({
                color: [249, 198, 8],
                width: 1.25
            }),
        })
    })
    const style = [labelStyle, regionStyle]
    const JSON_URL = "../../data/geojson/yn_region.json"

    // 行政区GeoJSON图层
    const regionLayer = new ol.layer.Vector({
        source: new ol.source.Vector({
            url: JSON_URL,
            format: new ol.format.GeoJSON()
        }),
        style: function (feature) {
            const label = feature.get("name").split(" ").join("n")
            labelStyle.getText().setText(label)
            return style
        },
        declutter: true
    })
    map.addLayer(regionLayer)
    map.getView().setCenter([101.485106, 25.008643])
    map.getView().setZoom(6.5)

    let drawLayer = undefined           // 绘制图层
    let drawType = undefined            // 绘制类型
    let drawInteraction = undefined     // 绘制对象
    let snapInteraction = undefined     // 捕捉对象
    const parentEle = document.querySelector(".main-ul")
    parentEle.addEventListener("click", evt => {
        const type = evt.target.dataset.type
        toogleActiveClass(evt.target, ".main-ul")
        if (type === "none") {
            removeAllActiveClass(".main-ul", ".active")
            drawType = undefined
            if (drawInteraction) {
                map.removeInteraction(drawInteraction)
                drawInteraction = undefined
            }
            if (snapInteraction) {
                map.removeInteraction(snapInteraction)
                snapInteraction = undefined
            }
            removeLayerByName("tempLayer", map)
            return
        } else {
            addInteraction(type)
        }
    })

    // 添加交互控件
    function addInteraction(type) {
        // 添加绘制图层
        drawLayer = new ol.layer.Vector({
            source: new ol.source.Vector(),
            style: drawStyle
        })
        drawLayer.set("layerName", "tempLayer")
        map.addLayer(drawLayer)

        switch (type) {
            case "line":
                drawType = "LineString"
                break
            case "polygon":
                drawType = "Polygon"
                break
        }
        // 节点捕捉控件
        snapInteraction = new ol.interaction.Snap({
            source: regionLayer.getSource()
        })
        // 绘制交互控件
        drawInteraction = new ol.interaction.Draw({
            source: drawLayer.getSource(),
            style: drawStyle,
            type: drawType,
            trace: true,  // 开启节点捕捉
            traceSource: regionLayer.getSource() // 节点捕捉数据源
        })
        map.addInteraction(drawInteraction)
        map.addInteraction(snapInteraction)
    }
</script>
❝
OpenLayers示例数据下载,请在公众号后台回复:ol数据
全国信息化工程师-GIS 应用水平考试资料,请在公众号后台回复:GIS考试
❝
GIS之路公众号已经接入了智能助手,欢迎大家前来提问。
欢迎访问我的博客网站-长谈GIS:
http://shanhaitalk.com
都看到这了,不要忘记点赞、收藏+关注 哦!
本号不定时更新有关 GIS开发 相关内容,欢迎关注 
