^ 关注我,带你一起学GIS ^
注:当前使用的是 ol [9.2.4] 版本,天地图使用的key请到天地图官网申请,并替换为自己的key
 前言
前言
❝
Landsat卫星数据具有很多波段,每种波段都有不同的用途。而对波段进行合成,根据波段类型组合形成不同的遥感影像对研究、应用具有更大的价值。遥感影像波段组合不仅能够获取更加全面和丰富的信息,还能提高影像的清晰度和增强地质解译能力。
1. 波段组合
在示例中,默认加载4、3、2波段
const bandSources = [
    {
        // red band
        url: BAND_URL + "B4.TIF",
        max: 15000,
        // min: 6842
    },
    {
        // green band
        url: BAND_URL + "B3.TIF",
        max: 15000,
        // min: 6566
    },
    {
        // blue band
        url: BAND_URL + "B2.TIF",
        max: 15000,
        // min: 4967
    },
]
在开关按钮事件中更新数据源对象,开关打开时显示添加,关闭时显示移除,并更新波段数组对象。如果只有一个开关时,设置不能关闭开关,将checked值设置为true然后返回。
form.on('switch(switch-box-filter)', function (data) {const elem = data.elem; // 获得 checkbox 原始 DOM 对象
const checked = elem.checked; // 获得 checkbox 选中状态
const value = elem.value; // 获得 checkbox 值
console.log("复选框信息:", data)
if (checked) {
const url = BAND_URL + elem.name + ".TIF"
bandSources.push({ url: url, max: 15000 })} else {
if (bandSources.length === 1) {
layer.msg("不能取消最后一个波段!")
elem.checked = true
return
}
// 查找目标对象索引
const index = bandSources.findIndex(band => band.name === elem.name)
bandSources.splice(index, 1)
}
bandSources.sort()
// 重新创建数据源
const source = new ol.source.GeoTIFF({
sources: bandSources,
nodata: 0, // 设置无效数据为0
// opaque: false, // 开启透明
// convertToRGB: true // 将色彩系统转换为RGB
})
tiffLayer.setSource(source)
});
2. 调整影像值
可以调整影像波段最大max最小值min,查看影像显示效果。对于波段像素值的大小,可以在ArcMap中进行查看。
3. 波段显示效果
-
432:自然真彩色
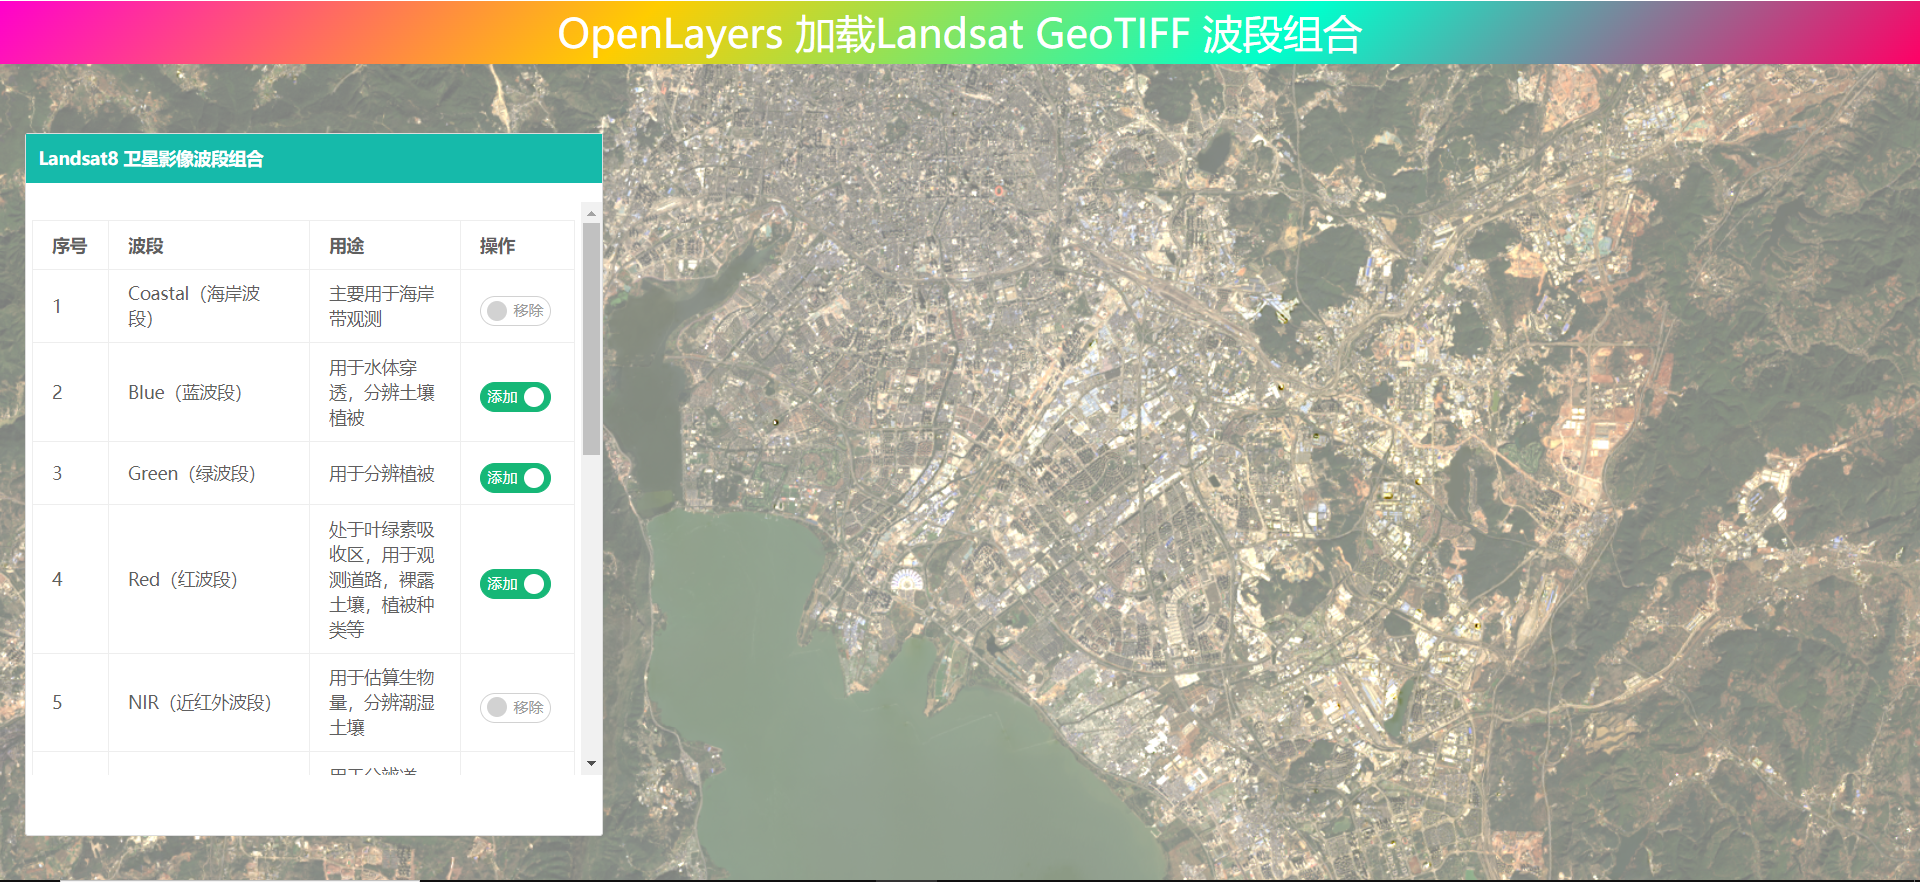
-
543:标准假彩色图像
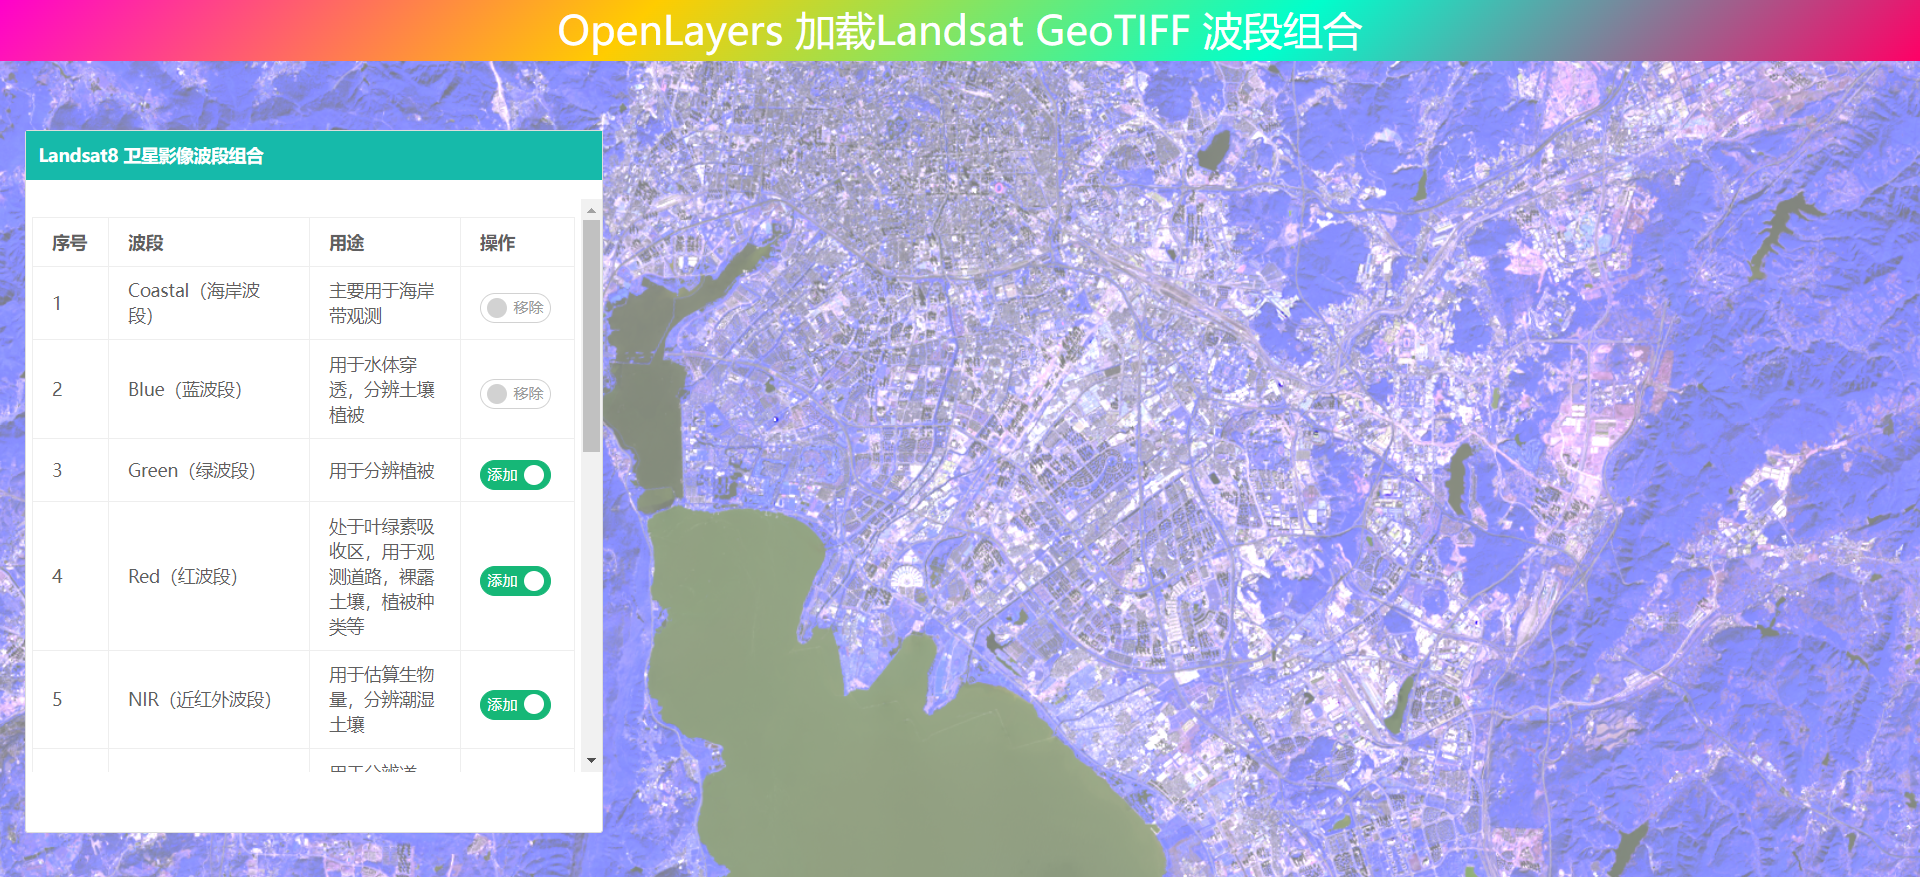
-
754:短波红外
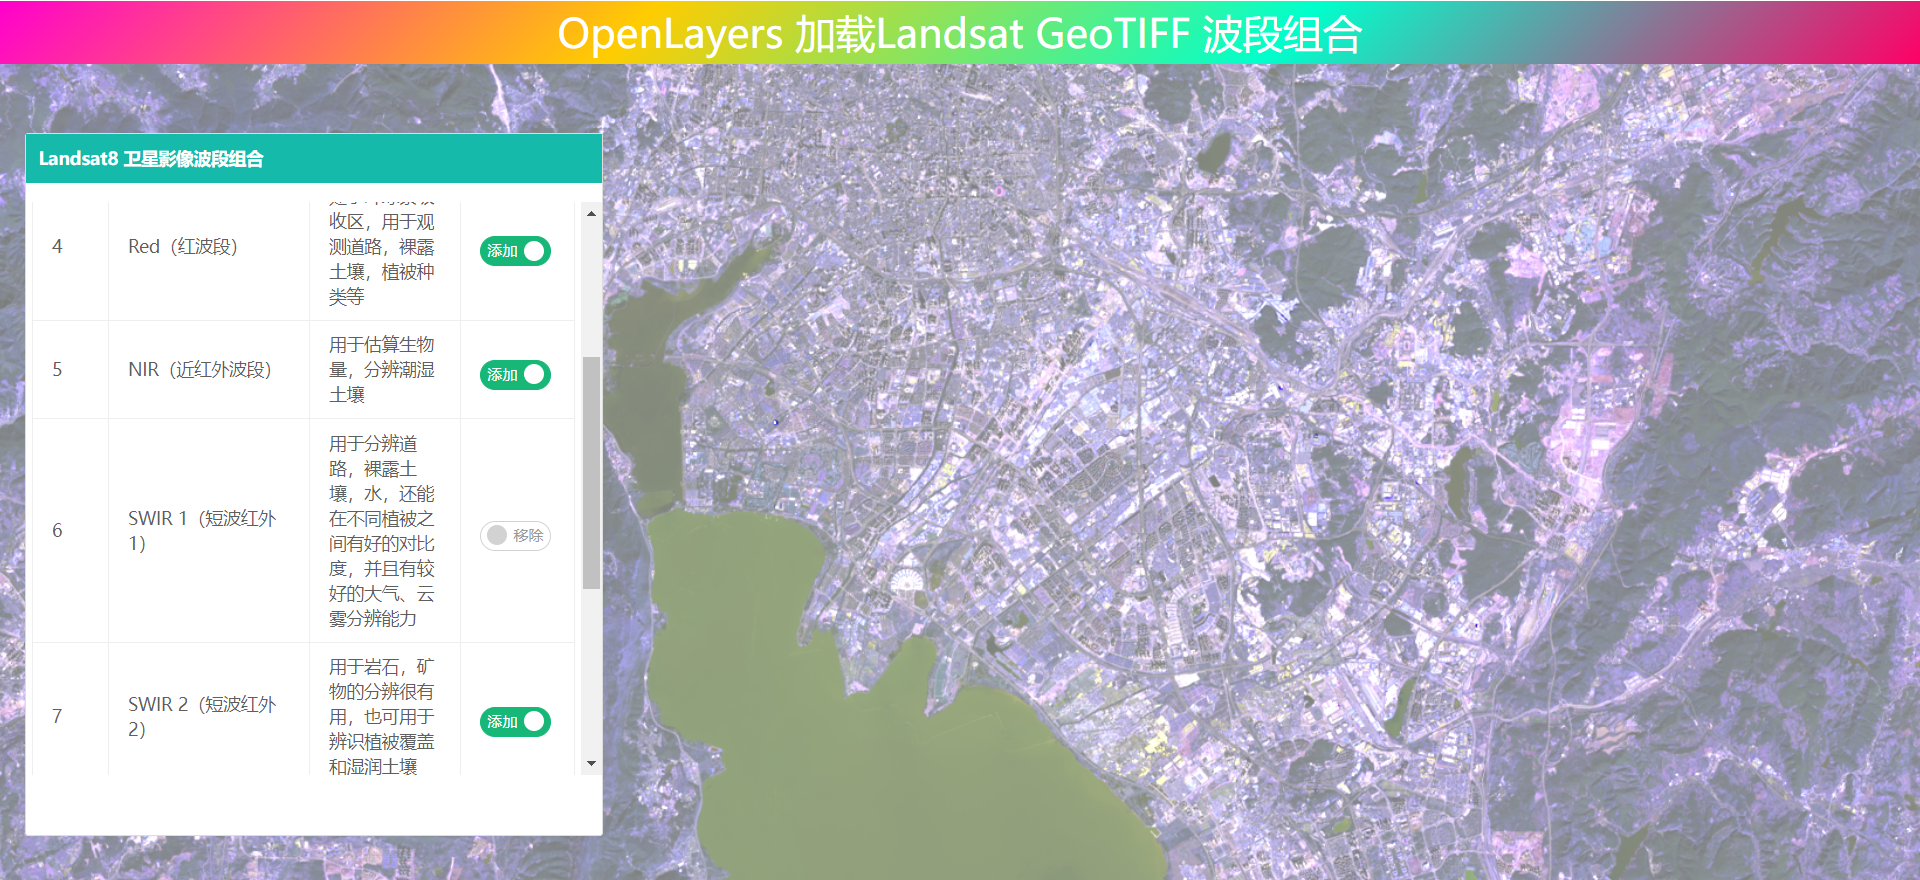
-
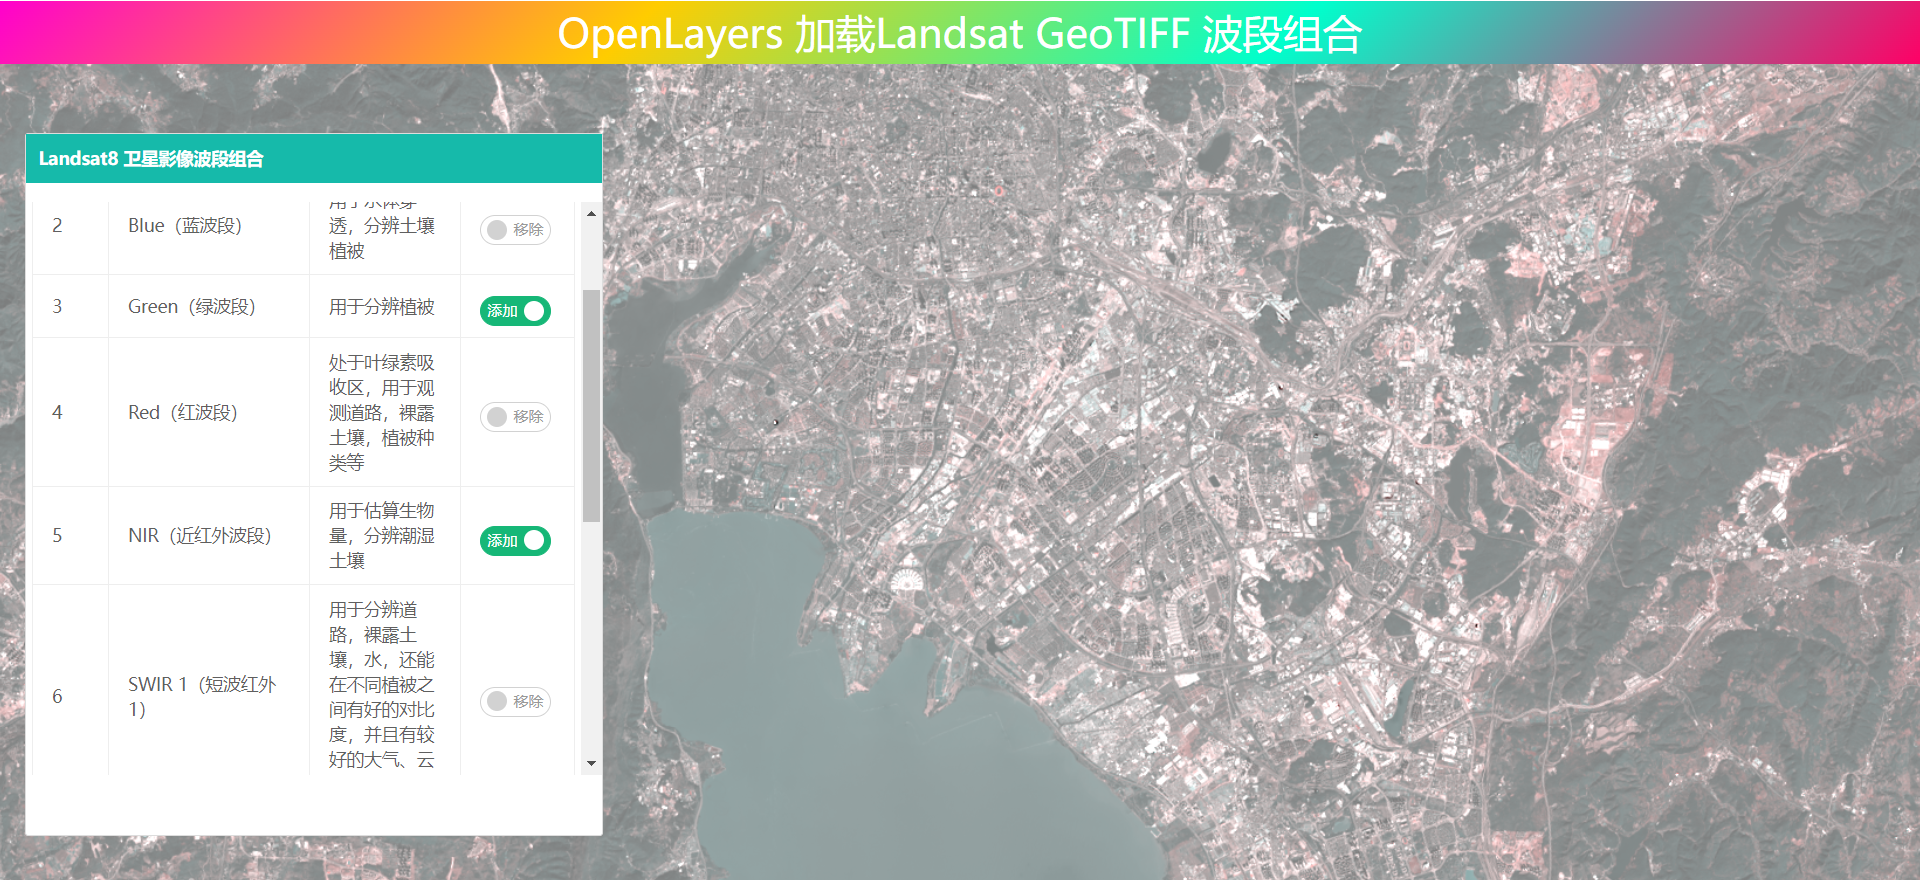
753:假彩色
4. 完整代码
其中libs文件夹下的包需要更换为自己下载的本地包或者引用在线资源。本示例引用了layui组件,请自行替换。
<!DOCTYPE html>
<html><head>
<meta http-equiv="Content-Type" content="text/html; charset=utf-8" />
<title>OpenLayers 加载GeoTIFF影像波段组合</title>
<meta charset="utf-8" /><script src="../../../libs/proj4.js"></script>
<script src="../../../js/ol9.2.4.js"></script>
<script src="../../../libs/layui/layui.js"></script><link rel="stylesheet" href="../../../css/ol9.2.4.css">
<link rel="stylesheet" href="../../../libs/layui/css/layui.css"><script src="../../../libs/js/geotiff.min.js"></script>
<style>
* {
padding: 0;
margin: 0;
font-size: 14px;
font-family: '微软雅黑';
}html,
body {
width: 100%;
height: 100%;
}#map {
position: absolute;
top: 50px;
bottom: 0;
width: 100%;
}#top-content {
position: absolute;
width: 100%;
height: 50px;
line-height: 50px;
background: linear-gradient(135deg, #ff00cc, #ffcc00, #00ffcc, #ff0066);
color: #fff;
text-align: center;
font-size: 32px;
}#top-content span {
font-size: 32px;
}#layer-container {
position: absolute;
top: 15%;
left: 20px;
width: 30%;
bottom: 5%;
background: #fff;
color: #fff;
border: 1px solid #ddd;
border-radius: 2.5px;
}.layer-head {
background: #16baaa;
padding: 10px;
margin-bottom: 15px;
}.layer-form {
padding: 0 10px;
}.layui-form-label {
width: 100%;
padding: 8px 15px;
height: 38px;
line-height: 20px;
border-width: 1px;
border-style: solid;
border-radius: 2px 0 0 2px;
text-align: center;
background-color: #fafafa;
overflow: hidden;
white-space: nowrap;
text-overflow: ellipsis;
box-sizing: border-box;
border-color: #eee;
font-weight: 400;
color: #000;
}.layui-icon-custome {
color: #ccc;
}.layui-icon-custome:hover {
cursor: pointer;
color: #1E9FFF;
}.layer-prop-set {
display: none;
position: absolute;
padding: 10px;
margin-top: 120px;
margin-left: 345px;
width: 250px;
background: #fff;
border-radius: 5px;
box-shadow: 5px 6px 6px 2px #d3d3d3;
}.layer-prop-item {
display: flex;
justify-content: space-between;
flex-direction: row;
margin: 10px 0;}
.layer-slider-item {
width: 70%;
margin-top: 7px;
}.clearfix::after {
display: block;
content: "";
clear: both;
}.band-table {
padding: 5px;
max-height: 80%;
overflow-y: scroll;
}
</style>
</head><body>
<div id="top-content">
<span>OpenLayers 加载Landsat GeoTIFF 波段组合</span>
</div>
<div id="map" title="地图显示"></div>
<div id="layer-container">
<h2 class="layer-head">Landsat8 卫星影像波段组合</h2>
<div class="band-table">
<table class="layui-table">
<!-- <colgroup>
<col>
<col>
<col>
</colgroup> -->
<thead>
<tr>
<th width="30px">序号</th>
<th width="130px">波段</th>
<th>用途</th>
<th width="60px">操作</th>
</tr>
</thead>
<tbody>
<tr>
<td>1</td>
<td>Coastal(海岸波段)</td>
<td>主要用于海岸带观测</td>
<td class="layui-form">
<input type="checkbox" lay-filter="switch-box-filter" title="添加|移除" name="B1"
lay-skin="switch">
</td>
</tr>
<tr>
<td>2</td>
<td>Blue(蓝波段)</td>
<td>用于水体穿透,分辨土壤植被</td>
<td class="layui-form">
<input type="checkbox" checked lay-filter="switch-box-filter" title="添加|移除" name="B2"
lay-skin="switch">
</td>
</tr>
<tr>
<td>3</td>
<td>Green(绿波段)</td>
<td>用于分辨植被</td>
<td class="layui-form">
<input type="checkbox" checked lay-filter="switch-box-filter" title="添加|移除" name="B3"
lay-skin="switch">
</td>
</tr>
<tr>
<td>4</td>
<td>Red(红波段)</td>
<td>处于叶绿素吸收区,用于观测道路,裸露土壤,植被种类等</td>
<td class="layui-form">
<input type="checkbox" checked lay-filter="switch-box-filter" title="添加|移除" name="B4"
lay-skin="switch">
</td>
</tr>
<tr>
<td>5</td>
<td>NIR(近红外波段)</td>
<td>用于估算生物量,分辨潮湿土壤</td>
<td class="layui-form">
<input type="checkbox" lay-filter="switch-box-filter" title="添加|移除" name="B5"
lay-skin="switch">
</td>
<tr>
<td>6</td>
<td>SWIR 1(短波红外1)</td>
<td class="layui-form">用于分辨道路,裸露土壤,水,还能在不同植被之间有好的对比度,并且有较好的大气、云雾分辨能力</td>
<td class="layui-form">
<input type="checkbox" lay-filter="switch-box-filter" title="添加|移除" name="B6"
lay-skin="switch">
</td>
</tr>
<tr>
<td>7</td>
<td>SWIR 2(短波红外2)</td>
<td>用于岩石,矿物的分辨很有用,也可用于辨识植被覆盖和湿润土壤</td>
<td class="layui-form">
<input type="checkbox" lay-filter="switch-box-filter" title="添加|移除" name="B7"
lay-skin="switch">
</td>
</tr>
<tr>
<td>8</td>
<td>Pan(全色波段)</td>
<td>为15米分辨率的黑白图像,用于增强分辨率</td>
<td class="layui-form">
<input type="checkbox" lay-filter="switch-box-filter" title="添加|移除" name="B8"
lay-skin="switch">
</td>
</tr>
<tr>
<td>9</td>
<td>Cirrus(卷云波段)</td>
<td>包含水汽强吸收特征,可用于云检测</td>
<td class="layui-form">
<input type="checkbox" lay-filter="switch-box-filter" title="添加|移除" name="B9"
lay-skin="switch">
</td>
</tr>
<tr>
<td>10</td>
<td>TIRS 1(热红外1)</td>
<td>感应热辐射的目标</td>
<td class="layui-form">
<input type="checkbox" lay-filter="switch-box-filter" title="添加|移除" name="B10"
lay-skin="switch">
</td>
</tr>
<tr>
<td>11</td>
<td>TIRS 2(热红外2)</td>
<td>感应热辐射的目标</td>
<td class="layui-form">
<input class="" type="checkbox" lay-filter="switch-box-filter" title="添加|移除" name="B11"
lay-skin="switch">
</td>
</tr>
</tbody>
</table>
</div>
</div>
</body></html>
<script>
const BAND_URL = "http://localhost/GeoTIFF/LC08_L2SP_129043_20211120_20211130_02_T1/LC08_L2SP_129043_20211120_20211130_02_T1_SR_"// const BAND_URL = "http://localhost/GeoTIFF/LC81300422021043LGN00/LC08_L1TP_130042_20210212_20210304_01_T1_"
const bandSources = [
{
// red band
url: BAND_URL + "B4.TIF",
max: 15000,
// min: 6842
},
{
// green band
url: BAND_URL + "B3.TIF",
max: 15000,
// min: 6566
},
{
// blue band
url: BAND_URL + "B2.TIF",
max: 15000,
// min: 4967
},
]
layui.use(function () {
const form = layui.form;
const layer = layui.layer// checkbox 事件
form.on('switch(switch-box-filter)', function (data) {const elem = data.elem; // 获得 checkbox 原始 DOM 对象
const checked = elem.checked; // 获得 checkbox 选中状态
const value = elem.value; // 获得 checkbox 值
console.log("复选框信息:", data)
if (checked) {
const url = BAND_URL + elem.name + ".TIF"
bandSources.push({ url: url, max: 15000 })} else {
if (bandSources.length === 1) {
layer.msg("不能取消最后一个波段!")
elem.checked = true
return
}
// 查找目标对象索引
const index = bandSources.findIndex(band => band.name === elem.name)
bandSources.splice(index, 1)
}
bandSources.sort()const source = new ol.source.GeoTIFF({
sources: bandSources,
nodata: 0, // 设置无效数据为0
// opaque: false, // 开启透明
// convertToRGB: true // 将色彩系统转换为RGB
})
tiffLayer.setSource(source)
});
});function createLayer(bandSources) {
const source = new ol.source.GeoTIFF({
sources: bandSources,
nodata: 0, // 设置无效数据为0
// opaque: false, // 开启透明
// convertToRGB: true // 将色彩系统转换为RGB
})
// 加载GeoTIFF影像数据
const tiffLayer = new ol.layer.WebGLTile({
source: source
})
return tiffLayer
}
const tiffLayer = createLayer(bandSources)
const source = tiffLayer.getSource()
source.getView().then(res => {
console.log(res)
})const map = new ol.Map({
target: "map",
loadTilesWhileInteracting: true,
view: source.getView(),
// 地图默认控件
controls: ol.control.defaults.defaults({
zoom: false,
attribution: true,
rotate: true
})
})
map.addLayer(tiffLayer)
</script>
波段数据组合介绍:
❝
OpenLayers示例数据下载,请在公众号后台回复:ol数据
全国信息化工程师-GIS 应用水平考试资料,请在公众号后台回复:GIS考试
❝
GIS之路公众号已经接入了智能助手,欢迎大家前来提问。
欢迎访问我的博客网站-长谈GIS:
http://shanhaitalk.com
都看到这了,不要忘记点赞、收藏+关注 哦!
本号不定时更新有关 GIS开发 相关内容,欢迎关注 
