^ 关注我,带你一起学GIS ^
注:当前使用的是 ol [9.2.4] 版本,天地图使用的key请到天地图官网申请,并替换为自己的key
 前言
前言
❝
GeoTIFF是开放地理控件联盟(OGC)实施标准,在TIFF的基础上,嵌入了地理空间元数据,也就是说,GeoTIFF是带有地理空间参考和地理数据的TIFF文件。其中GeoTIFF元数据包括坐标系、地图投影以及特定位置信息等。GeoTIFF格式广泛应用于航空影像、卫星影像以及数字高程模型中。在上节介绍了OpenLayers加载iis部署的GeoTIFF影像,
本节主要介绍采用Blob的方式加载GeoTIFF影像。OpenLayers加载iis部署的GeoTIFF影像链接:
1. 下载GeoTIFF数据
下载GeoTIFF数据,请参考GIS 影像数据源介绍。https://www.yuque.com/u37362584/pg4zca/nmw9pt7fgzkbfx3h#Geag9
2. 添加geotiff.js库
在OpenLayers中加载GeoTIFF影像之前,需要先引入geotiff.js库。cdn 地址:https://www.jsdelivr.com/package/npm/geotiff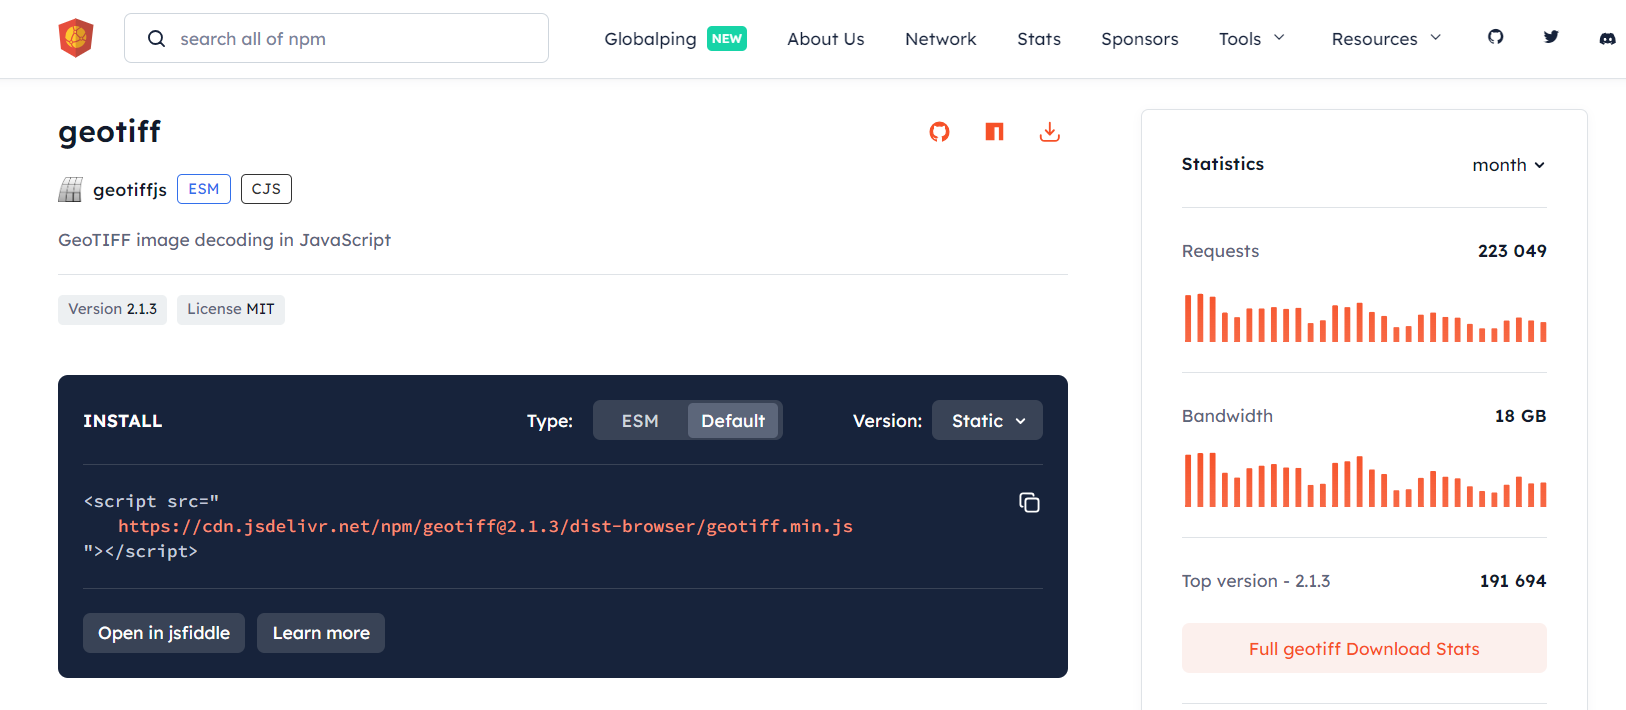
3. IIS部署GeoTIFF文件
在本机测试可以采用windows自带的web服务器iis部署GeoTIFF文件,然后通过http进行访问
4. 加载GeoTIFF文件
通过fetch接口请求tif数据,然后调用blob()获取文件数据。
    const url = "http://localhost/GeoTIFF/s1a_clip.tif"
    fetch(url)
        .then(response => response.blob())
        .then(blob => {
            console.log("blob:", blob)
            const source = new ol.source.GeoTIFF({
                sources: [
                    {
                        blob: blob
                    }
                ],
                nodata: 0, // 设置无效数据为0
                opaque: true, // 开启透明
                convertToRGB: true // 将色彩系统转换为RGB
            })

            // 加载GeoTIFF影像数据
            const tiffLayer = new ol.layer.WebGLTile({
                source: source
            })
            const map = new ol.Map({
                target: "map",
                loadTilesWhileInteracting: true,
                layers: [tiffLayer],
                view: source.getView().then(viewConfig => {
                    console.log("viewConfig:", viewConfig)
                    viewConfig.showFullExtent = true // 初始化时全幅显示图层
                    // viewConfig.extent = []
                    return viewConfig
                }),
                // 地图默认控件
                controls: ol.control.defaults.defaults({
                    zoom: false,
                    attribution: true,
                    rotate: true
                })
            })
        })
5. 完整代码
其中libs文件夹下的包需要更换为自己下载的本地包或者引用在线资源。本示例引用了layui组件,请自行替换。
<!DOCTYPE html>
<html>

<head>
    <meta http-equiv="Content-Type" content="text/html; charset=utf-8" />
    <title>加载GeoTIFF影像</title>
    <meta charset="utf-8" />

    <script src="../../../js/ol9.2.4.js"></script>
    <script src="../../../libs/layui/layui.js"></script>

    <link rel="stylesheet" href="../../../css/ol9.2.4.css">
    <link rel="stylesheet" href="../../../libs/layui/css/layui.css">

    <script src="https://cdn.jsdelivr.net/npm/geotiff@2.1.3/dist-browser/geotiff.min.js"></script>
    <style>
        * {
            padding: 0;
            margin: 0;
            font-size: 14px;
            font-family: '微软雅黑';
        }

        html,
        body {
            width: 100%;
            height: 100%;
        }

        #map {
            position: absolute;
            top: 50px;
            bottom: 0;
            width: 100%;
        }

        #top-content {
            position: absolute;
            width: 100%;
            height: 50px;
            line-height: 50px;
            background: linear-gradient(135deg, #ff00cc, #ffcc00, #00ffcc, #ff0066);
            color: #fff;
            text-align: center;
            font-size: 32px;
        }

        #top-content span {
            font-size: 32px;
        }
    </style>
</head>

<body>
    <div id="top-content">
        <span>加载GeoTIFF影像数据</span>
    </div>
    <div id="map" title="地图显示"></div>

</body>

</html>

<script>

    /** 自行更换为本地tif文件地址**/

    // url: "http://localhost/GeoTIFF/tci.tif"
    // url: "http://localhost/GeoTIFF/LC08_B7.tif"
    // url: "http://localhost/GeoTIFF/s1a_clip.tif"
    // url: "http://localhost/GeoTIFF/LC08_B1.tif"
    // url: "http://localhost/GeoTIFF/LE07_clip.tif"

    const url = "http://localhost/GeoTIFF/s1a_clip.tif"
    fetch(url)
        .then(response => response.blob())
        .then(blob => {
            const source = new ol.source.GeoTIFF({
                sources: [
                    {
                        blob: blob
                    }
                ],
                nodata: 0, // 设置无效数据为0
                opaque: true, // 开启透明
                convertToRGB: true // 将色彩系统转换为RGB
            })

            // 加载GeoTIFF影像数据
            const tiffLayer = new ol.layer.WebGLTile({
                source: source
            })

            const map = new ol.Map({
                target: "map",
                loadTilesWhileInteracting: true,
                layers: [tiffLayer],
                view: source.getView().then(viewConfig => {
                    console.log("viewConfig:", viewConfig)
                    viewConfig.showFullExtent = true // 初始化时全幅显示图层
                    // viewConfig.extent = []
                    // for (let i = 2; i < 5; i++) {
                    //     viewConfig.resolutions.unshift(Math.pow(i, 2))
                    // }
                    return viewConfig
                }),
                // 地图默认控件
                controls: ol.control.defaults.defaults({
                    zoom: false,
                    attribution: true,
                    rotate: true
                })
            })
        })
</script>
❝
OpenLayers示例数据下载,请在公众号后台回复:ol数据
全国信息化工程师-GIS 应用水平考试资料,请在公众号后台回复:GIS考试
❝
GIS之路公众号已经接入了智能助手,欢迎大家前来提问。
欢迎访问我的博客网站-长谈GIS:
http://shanhaitalk.com
都看到这了,不要忘记点赞、收藏+关注 哦!
本号不定时更新有关 GIS开发 相关内容,欢迎关注 
