^ 关注我,带你一起学GIS ^
注:当前使用的是 ol [9.2.4] 版本,天地图使用的key请到天地图官网申请,并替换为自己的key
 前言
前言
❝OpenLayers 样式功能非常强大,并且提供了创建样式的多种方式,了解和掌握各种创建样式的方式方法,有助于提高开发能力、提升开发效率。
1. 通过Style对象创建
使用ol.style.Style创建样式对象,可以设置要素渲染样式。这是常见的样式使用方式。
在Style对象中可以设置要渲染的几何对象geometry、要素填充样式、描边样式以及点要素样式和文本样式等。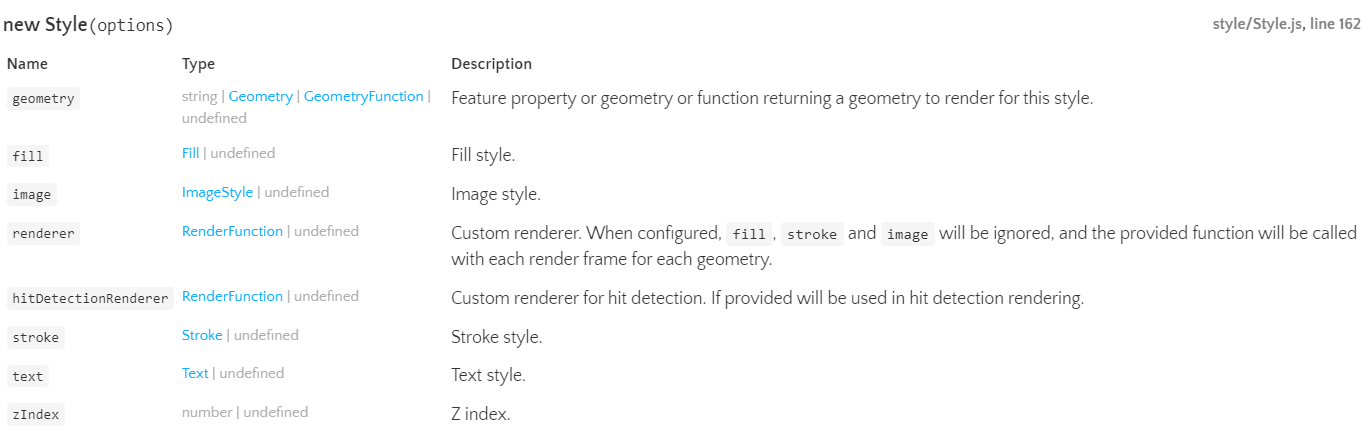
Style样式对象代码如下,其中image属性既可以创建Circle样式,也可以创建ol.style.Icon图标样式。
const featureStyle = new ol.style.Style({
    // 要素填充样式
    fill: new ol.style.Fill({
        color: [230, 230, 250, 0.25],
    }),
    // 要素描边样式
    stroke: new ol.style.Stroke({
        color: "#00FFFF",
        width: 1.25,
    }),
    // 点填充样式
    image: new ol.style.Circle({
        radius: 10,
        fill: new ol.style.Fill({
            color: "#fff"
        }),
        stroke: new ol.style.Stroke({
            color: "red"
        })
    })
})
读者对标注感兴趣的话可以阅读文章:OpenLayers 图文标注大全
2. 通过样式函数创建
样式函数接收一个要素和一个表示视图分辨率的数字。使用该函数应返回一个Style对象或者一个包含Style对象的样式数组。
创建文本标注和要素填充样式。
// 文字样式
const labelStyle = new ol.style.Style({
    text: new ol.style.Text({
        font: '12px Calibri,sans-serif',
        overflow: true,
        // 填充色
        fill: new ol.style.Fill({
            color: "#FAFAD2"
        }),
        // 描边色
        stroke: new ol.style.Stroke({
            color: "#2F4F4F",
            width: 3,
        }),
    })
})
// 行政区样式
const regionStyle = new ol.style.Style({
    fill: new ol.style.Fill({
        // color: 'rgba(255, 255, 255, 0.6)',
        color: [230, 230, 250, 0.25],
    }),
    stroke: new ol.style.Stroke({
        color: "#00FFFF",
        width: 1.25,
    }),
})

const style = [labelStyle, regionStyle]
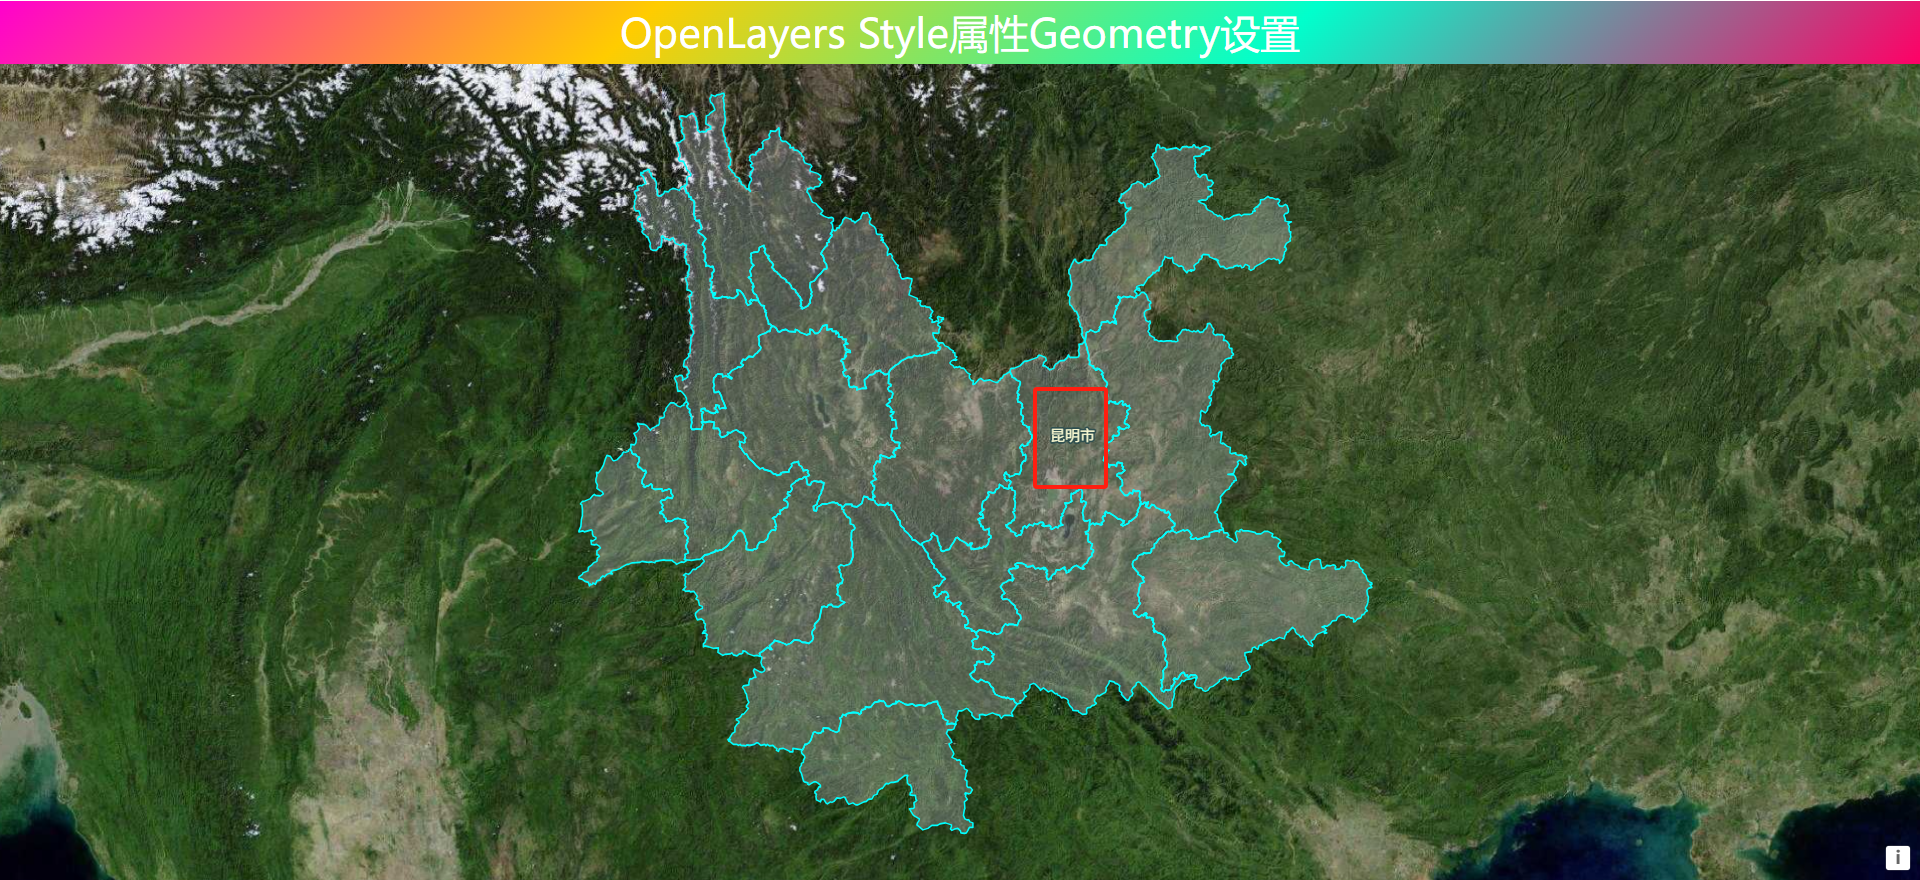
只标注目标几何对象
// 样式函数
style: function (feature) {
    const label = feature.get("name").split(" ").join("n")
    labelStyle.getText().setText(label)
    if (label === "昆明市") {
        const targetGeometry = feature.getGeometry()
        labelStyle.setGeometry(targetGeometry)
    }
    return style
}
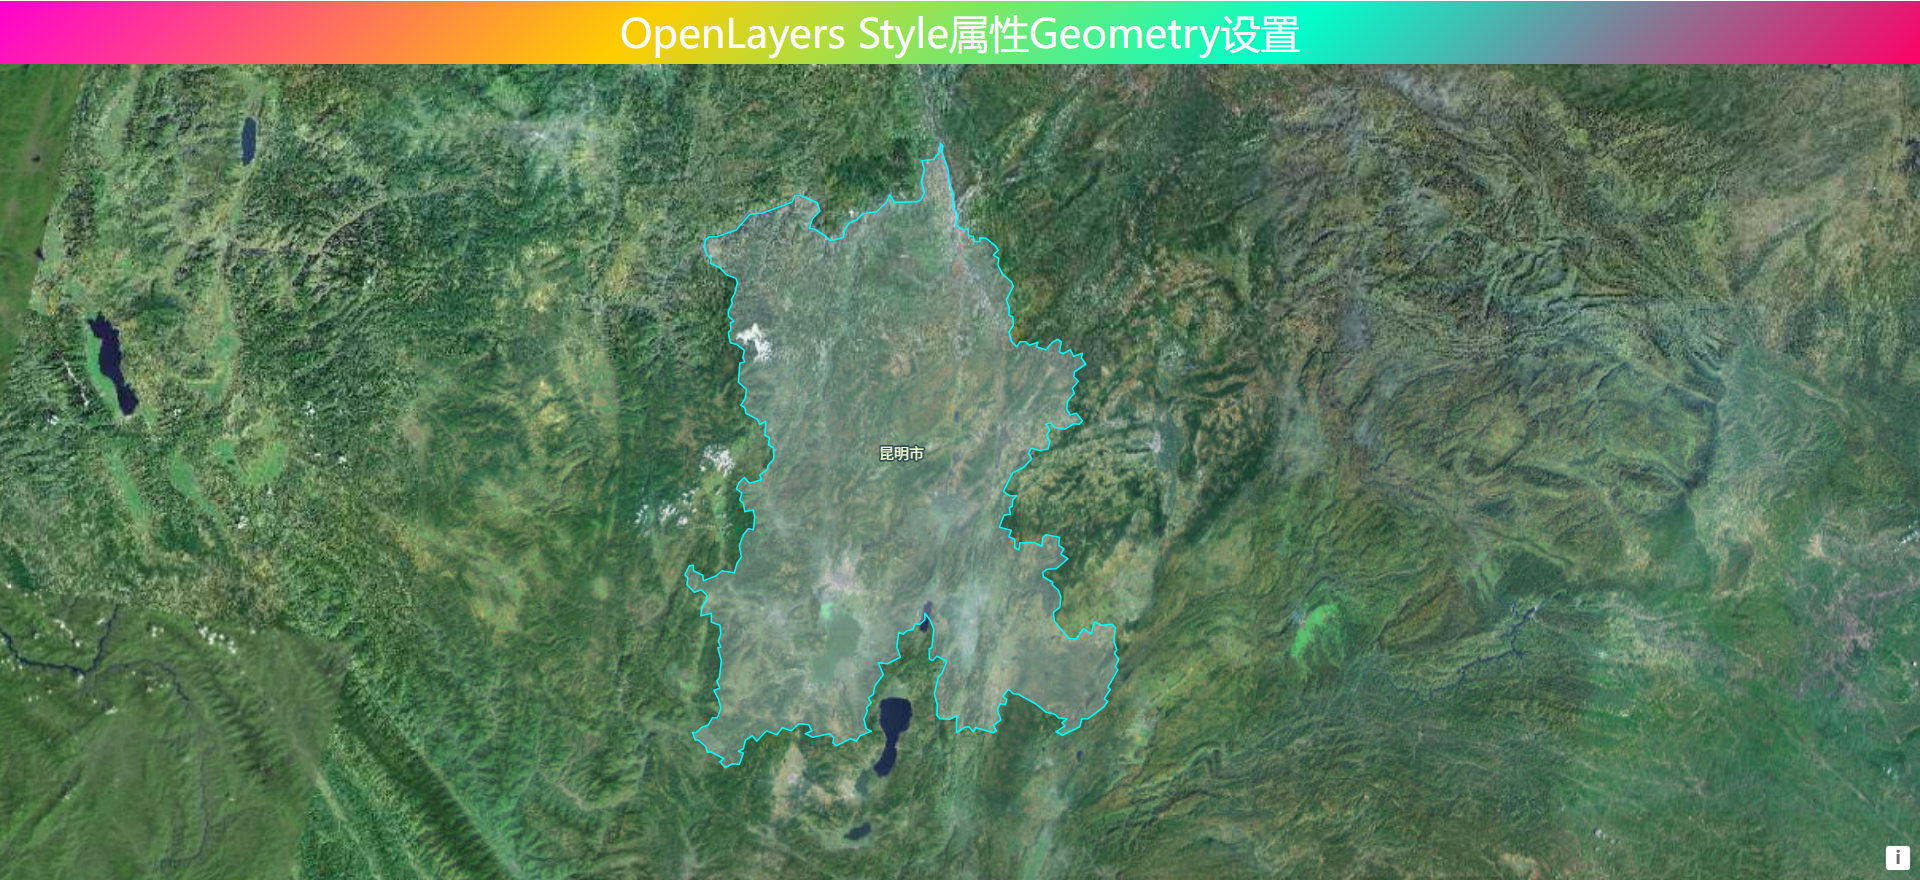
只渲染并标注目标几何对象
style: function (feature) {
    const label = feature.get("name").split(" ").join("n")
    if (label === "昆明市") {
        labelStyle.getText().setText(label)
        const targetGeometry = feature.getGeometry()
        labelStyle.setGeometry(targetGeometry)
        return style
    }
}
除了在图层对象属性style中使用样式函数外,还可以在外部创建样式函数,然后通过setStyle方法渲染样式。
// 创建样式函数
const styleFunction = function (feature) {
    const label = feature.get("name").split(" ").join("n")
    labelStyle.getText().setText(label)
    if (label === "昆明市") {
        const targetGeometry = feature.getGeometry()
        labelStyle.setGeometry(targetGeometry)
        return style
    }

}
// 设置样式
layer.setStyle(styleFunction)
3. 通过样式数组创建
在样式数组中可以创建多个样式对象,比如文本标注对象、要素渲染对象、图标渲染对象。
const styles = [
    // 文字样式
    const labelStyle = new ol.style.Style({
      text: new ol.style.Text({
          font: '12px Calibri,sans-serif',
          overflow: true,
          // 填充色
          fill: new ol.style.Fill({
              color: "#FAFAD2"
          }),
          // 描边色
          stroke: new ol.style.Stroke({
              color: "#2F4F4F",
              width: 3,
          }),
      })
    })
    // 行政区样式
    const regionStyle = new ol.style.Style({
      fill: new ol.style.Fill({
          // color: 'rgba(255, 255, 255, 0.6)',
          color: [230, 230, 250, 0.25],
      }),
      stroke: new ol.style.Stroke({
          color: "#00FFFF",
          width: 1.25,
      }),
    })
]
4. 通过扁平化样式创建
使用扁平化样式对象在要素渲染时非常便捷,比起Style对象可以减少很多代码量。默认的扁平化样式对象如下。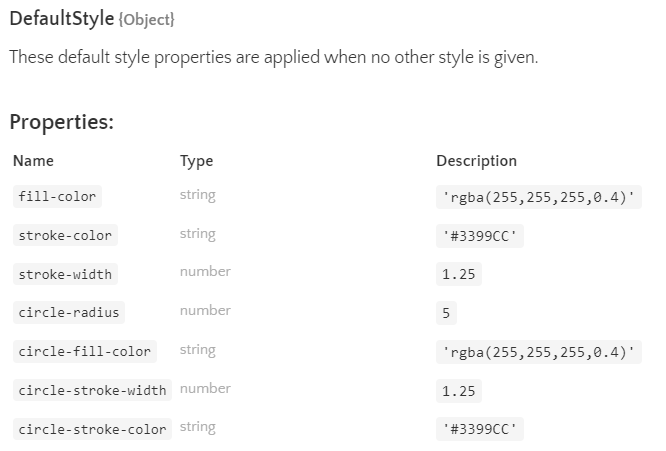
扁平化样式结构
style: {
    "text-value": "行政区名称",
    "text-fill-color": "#EEE8AA",
    "text-stroke-color": "#2F4F4F",
    "fill-color": [230, 230, 250, 0.25],
    "stroke-color": "#00FFFF",
    "stroke-width": 1.25
}
使用以上样式对象渲染效果如下。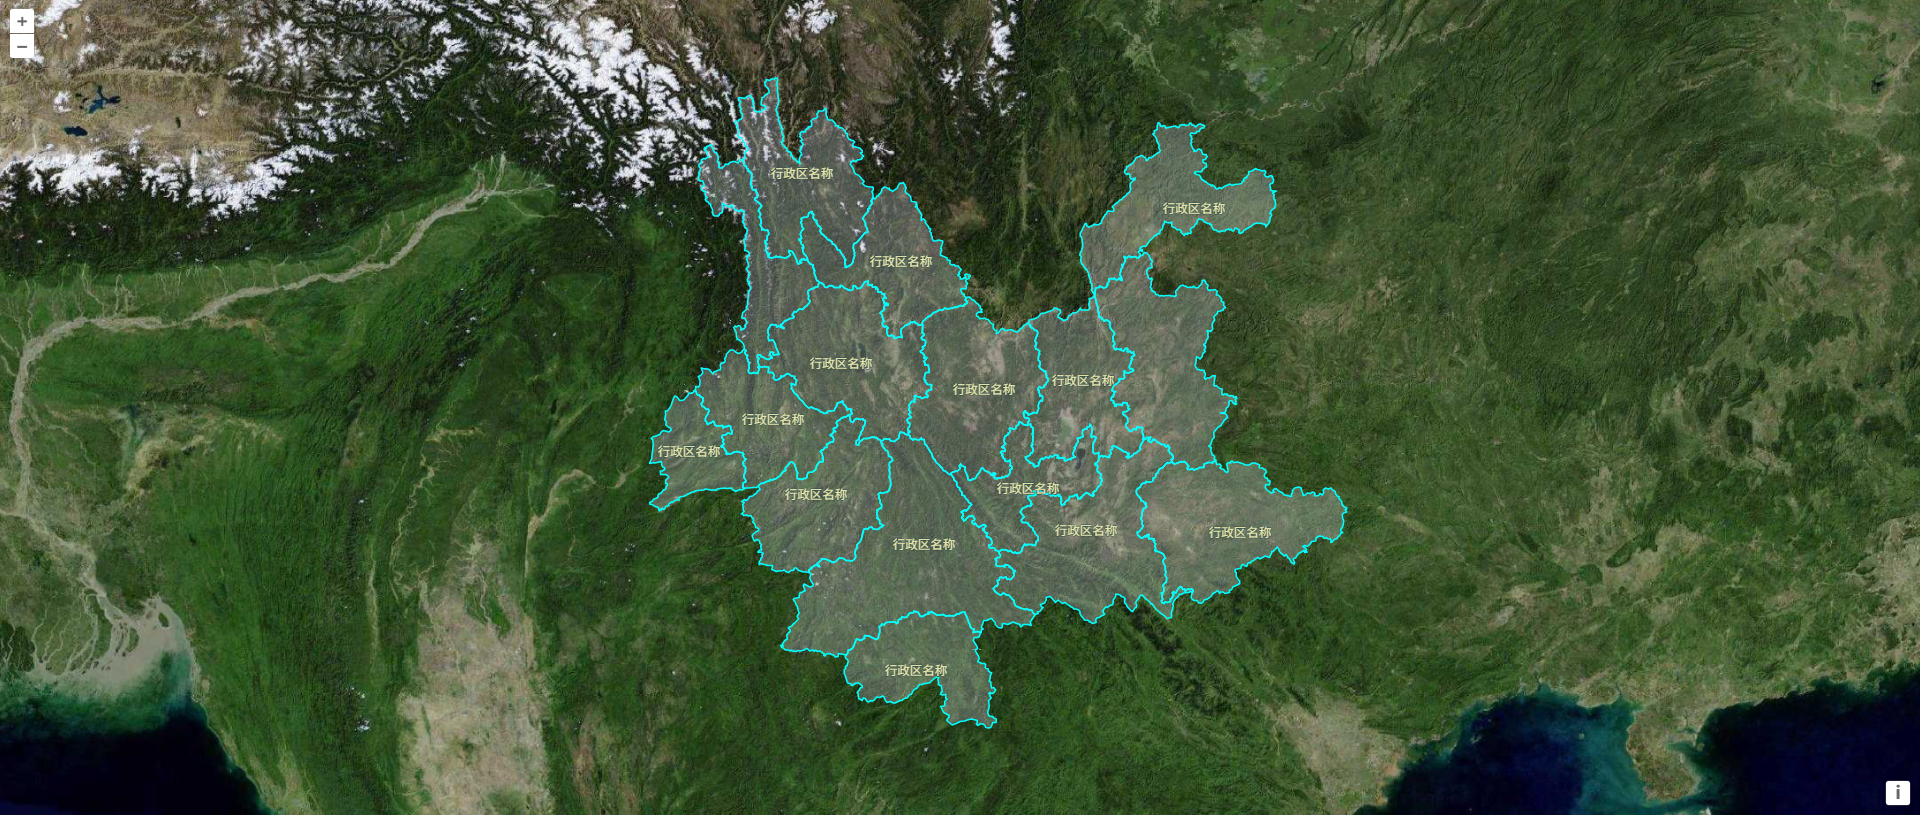
5. 通过样式表达式创建
样式表达式其实可以包含在扁平化样式章节中,只是样式表达式比较复杂,内容比较多,而上节扁平化样式很简单,只是使用默认值,所以将样式表达式分出来单独讲解。
在扁平化样式对象中,样式属性既可以直接设置对应属性值如"fill-color": [230, 230, 250, 0.25],也可以通过样式表达式设置。具有字符样式表达式、数学样式表达式、以及布尔样式表达式等内容。
字符表达式
字符表达式是实现地图要素个性化展示的关键工具。它通过简洁而强大的语法,允许开发者根据数据属性动态生成样式,从而赋予地图要素更具表现力的视觉效果。详情可以参考文章:OpenLayers 字符表达式
// 连接表达式
style: {
    "text-value": ["concat", ['get', 'name'], "n------n", ["get", "GDP"], "(亿元)"],
    "text-fill-color": "#FAFAD2",
    "text-stroke-color": "#2F4F4F",
    "fill-color": [230, 230, 250, 0.25],
    "stroke-color": "#00FFFF",
    "stroke-width": 1.25
}
通过字符表达式实现文字分层分段标注。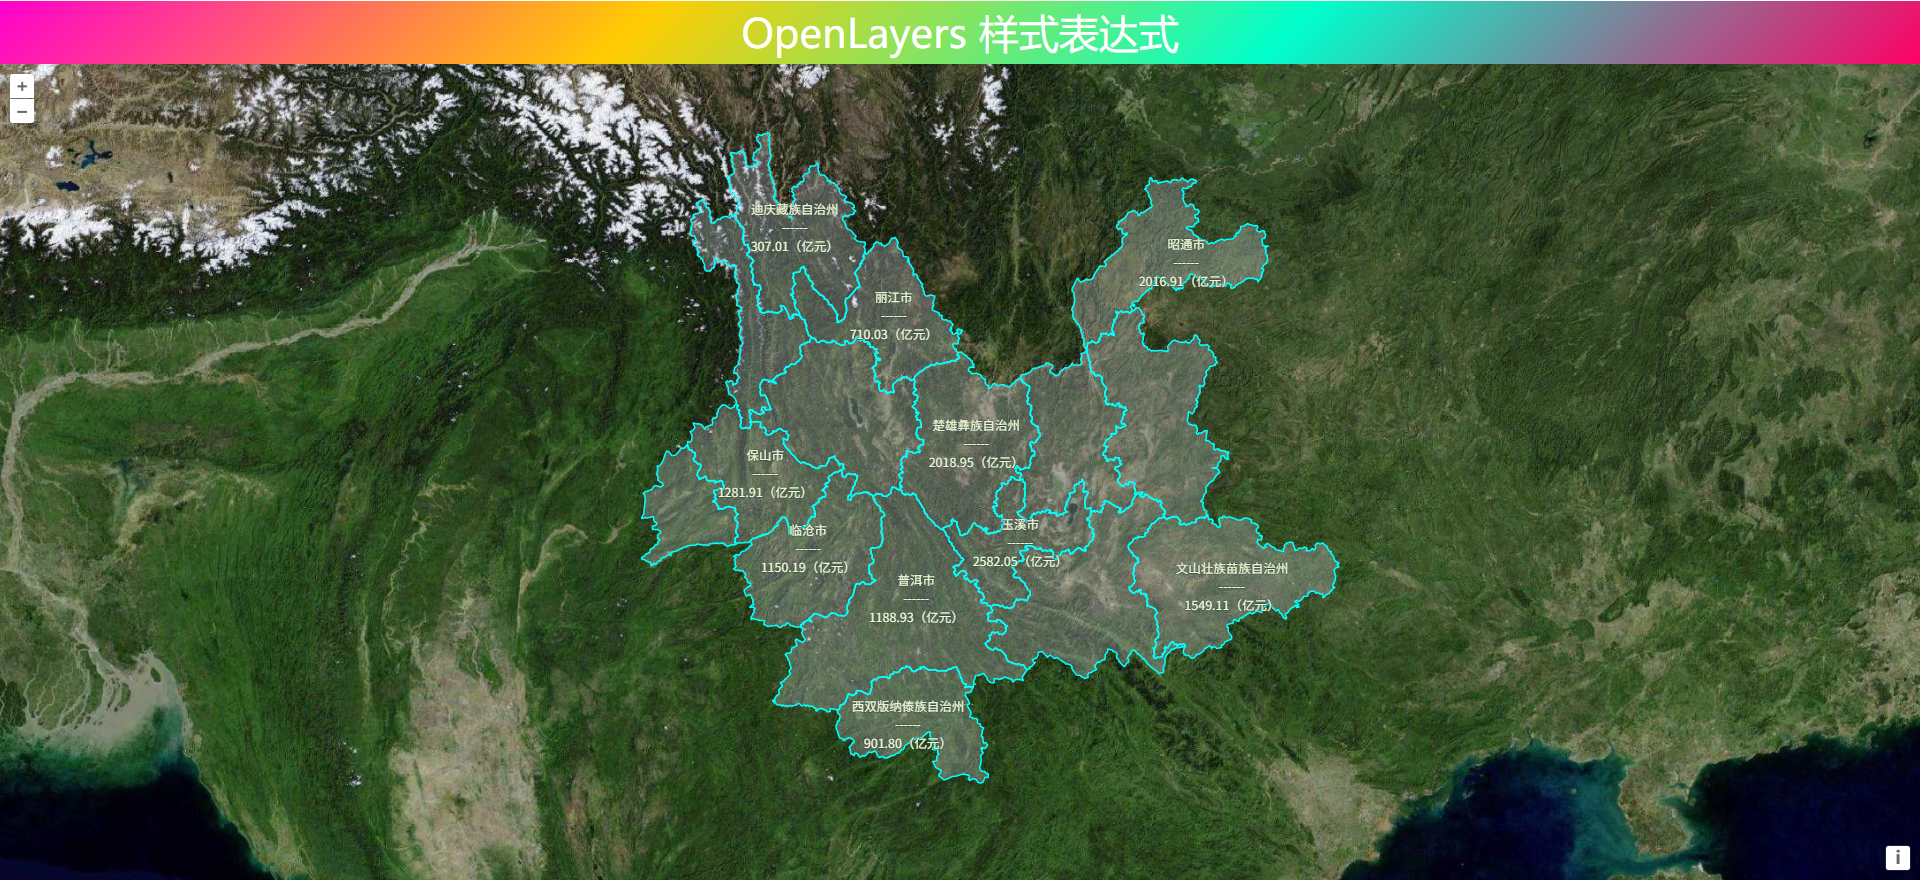
数学表达式
数学表达式是连接数据与可视化、逻辑与操作的核心纽带。能够动态处理要素属性、地图状态和用户交互数据,显著增强地图的可视化能力和交互灵活性。详情可以参考文章:OpenLayers 数学表达式
// 数学样式表达式
style: {
    "text-value": ["concat", ["get", "GDP"], "(亿元)", "n------n", ["*", ["/", ["round", ["*", ["/", ["get", "GDP"], ["get", "total"]], 10000]], 10000], 100], " %"],
    "text-fill-color": ["case", [">", ["get", "GDP"], 2000], "#FAFAD2", "#ffc107bd"],
    "text-stroke-color": "#2F4F4F",
    "fill-color": ["case", [">", ["get", "GDP"], 2000], "#ff9933c9", "#33ff9975"],
    "stroke-color": "#00FFFF",
    "stroke-width": 1.25
}
通过数学表达式实现要素分级分类标注。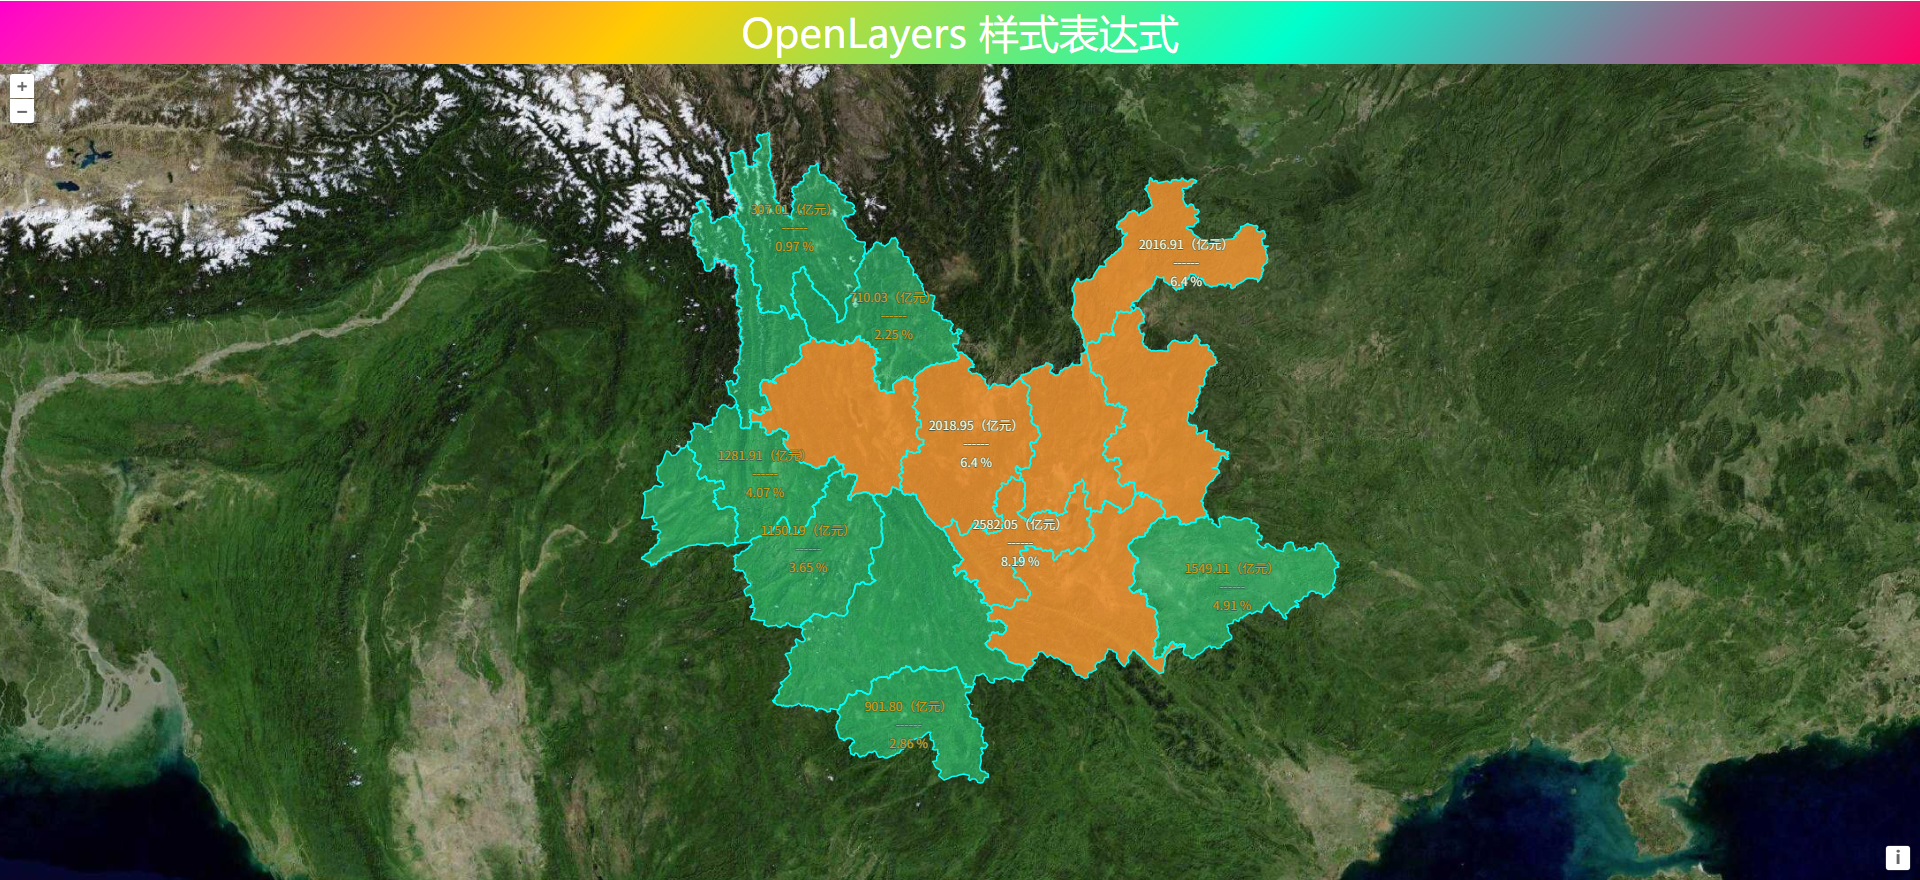
布尔表达式
布尔运算主要用于在样式表达式中进行条件判断和逻辑操作,从而根据数据特征动态调整地图要素的样式,实时调整地图的显示效果,从而更好地突出重要信息,提升地图的可读性和交互性。详情可以参考文章:OpenLayers 布尔表达式
// 逻辑非表达式
style: {
    "text-value": ["concat", ["get", "name"], "n--------------------n", ["get", "GDP"]],
    "text-fill-color": ["match", ["get", "name"], "昆明市(磨憨)", "#FFFF00", "楚雄彝族自治州", "#FFA500", "#EEE8AA"],
    "text-stroke-color": "#2F4F4F",
    "fill-color": ["case", ["any", ["==", ["get", "name"], "昆明市(磨憨)"], ["==", ["get", "name"], "楚雄彝族自治州"]], "#ff9933c9", "#33ff9975"],
    "stroke-color": "#00FFFF",
    "stroke-width": 1.25
}
通过布尔表达式实现要素根据条件分类分级标注。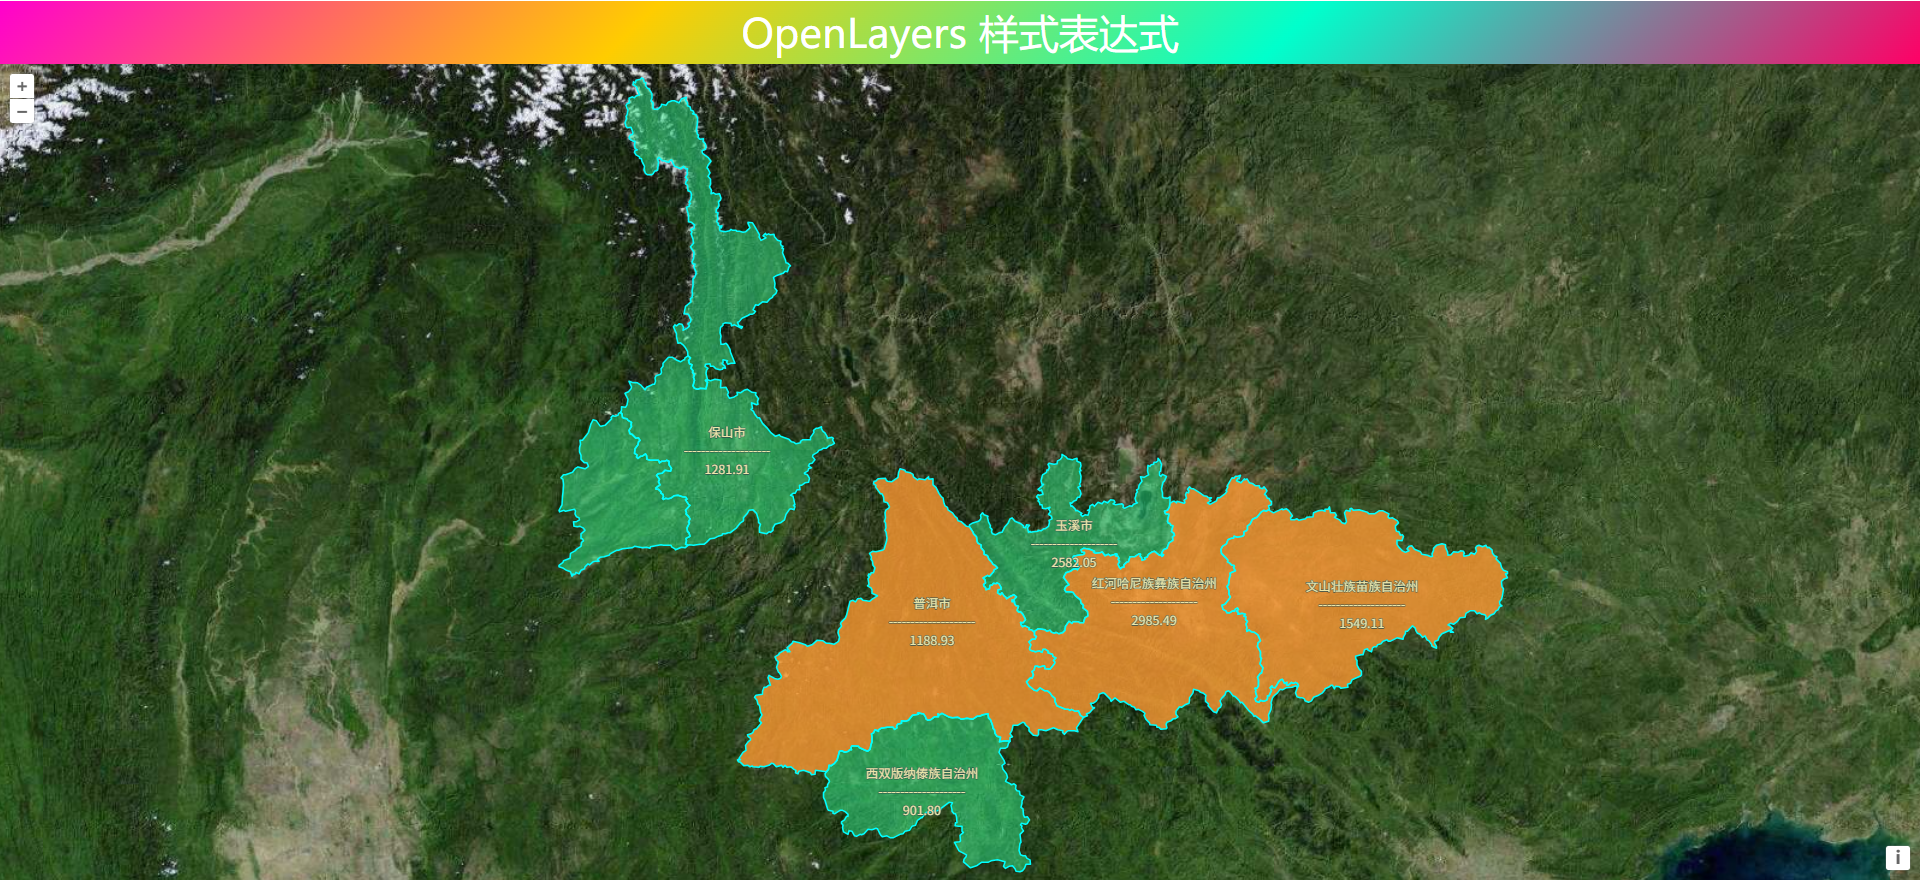
❝
OpenLayers示例数据下载,请在公众号后台回复:ol数据
全国信息化工程师-GIS 应用水平考试资料,请在公众号后台回复:GIS考试
❝
GIS之路公众号已经接入了智能助手,欢迎大家前来提问。
欢迎访问我的博客网站-长谈GIS:
http://shanhaitalk.com
都看到这了,不要忘记点赞、收藏+关注 哦!
本号不定时更新有关 GIS开发 相关内容,欢迎关注 
