^ 关注我,带你一起学GIS ^
注:当前使用的是 ol [9.2.4] 版本,天地图使用的key请到天地图官网申请,并替换为自己的key
 前言
前言
❝GIS开发中,地图标注是一个重要功能,如何实现美观、高效的文本标注是一个值得思考的问题。在进行地图标注时,某些情况下需要标注多个字段信息,可以实现左右分隔标注或者上下标注。而在OpenLayers中已经给我们提供了这种标注的实现方式————富文本标注
1. 数据准备
在进行数据标注前,需要准备相应的地图数据,在本文中以GeoJSON数据为例进行讲解。通过下载云南省行政区范围GeoJSON数据,然后将云南省16个州市的GDP数据写入属性信息中进行展示。数据结构如下。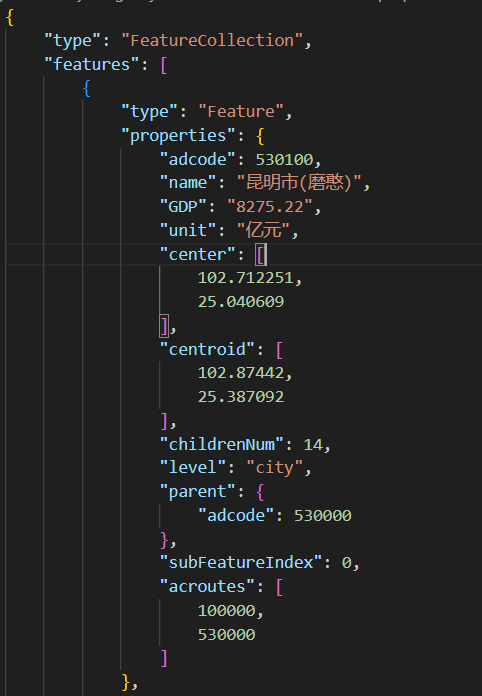
如果你还不知道怎么下载GeoJSON数据源请参考文章:GeoJSON 数据源站介绍如果你想进一步了解GeoJSON数据请参考文章:GeoJSON 数据简介
2. 创建标注样式
在项目中创建文字标注样式和行政区样式,文字标注通过样式类(Style)属性ol.style.Text类设置,可以设置字体、填充颜色和边线颜色;行政区样式通过样式类(Style)填充属性和描边属性进行设置。OpenLayers中Color属性可以设置成字符串"#2F4F4F"或者rgba(255, 255, 255, 0.6)或者直接设置成颜色值"red"。
// 文字样式
const labelStyle = new ol.style.Style({
    text: new ol.style.Text({
        font: '12px Calibri,sans-serif',
        overflow: true,
        // 填充色
        fill: new ol.style.Fill({
            color: "#FAFAD2"
        }),
        // 描边色
        stroke: new ol.style.Stroke({
            color: "#2F4F4F",
            width: 3,
        }),
    })
})
// 行政区样式
const regionStyle = new ol.style.Style({
    fill: new ol.style.Fill({
        color: [230, 230, 250, 0.25],
    }),
    stroke: new ol.style.Stroke({
        color: "#00FFFF",
        width: 1.25,
    }),
})
3. 设置文本标注
在矢量图层中创建矢量数据源,将矢量数据源的format属性设置为new ol.format.GeoJSON(),并且设置url属性指向下载的GeoJSON文件存储路径,然后设置图层标注样式。
const JSON_URL = "../../data/geojson/yn_region.json"
const layer = new ol.layer.Vector({
    source: new ol.source.Vector({
        url: JSON_URL,
        format: new ol.format.GeoJSON(),
    }),
    style: function (feature) {
        const label = feature.get("name").split(" ").join("n")
        labelStyle.getText().setText([
            label,
            '16px sans-serif',
            'n',
            '',
            '————',
            '',
            'n',
            '',
            `${feature.get("GDP")}`,
            "12px bold italic Calibri",
            `(${feature.get("unit")})`,
            '12px sans-serif',
        ])
        return style
    },
    declutter: true
})
在如上方设置完成样式标注后,可以看到富文本标注更加丰富、强大的标注能力。在本例中将实现如箭头右图所示上下分隔标注内容。将行政区名称显示在上方,中间用”——”分隔,下方标注内容为GDP数值和单位。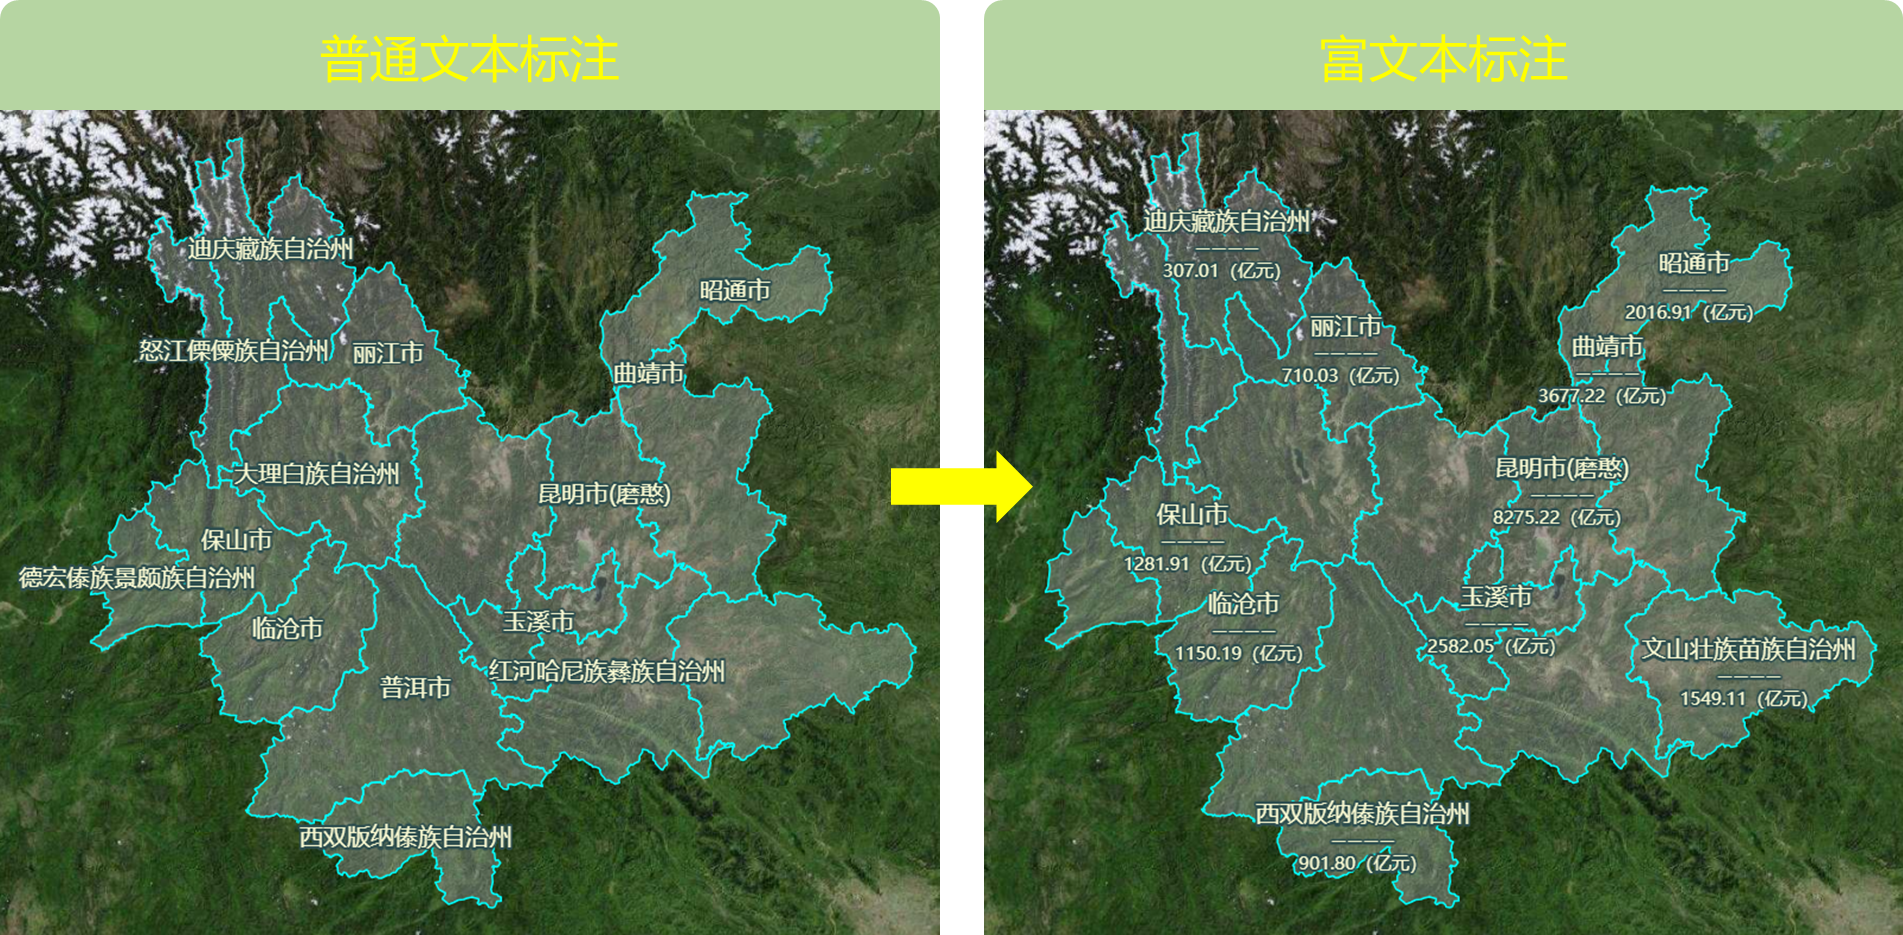
现在讲一下在OpenLayers开发工作中如何设置富文本标注。富文本标注的实现应使用样式函数来完成,该函数具有一个Feature类型的参数为feature,即要标注的要素。在该要素中,可以获取要标注的文本内容,如例子中的行政区名称(name)、GDP、标注单位(unit)。
然后通过setText方法设置标注文本,该方法可以接受字符串、字符串数组类型的文本。要实现富文本标注,需要传入字符串数组。
可以将文本标注内容划分为组,如下图在设置行政区名称和GDP数值标注时将标注内容划分为6组。每一组内容又可以划分为上下两个要素,前一个要素是标注内容,后一个要素是标注样式,该标注样式为字体值,包括字体大小、使用字体、是否加粗、是否倾斜等。如若需要换行,实现文本上下标注,则需要设置如下图2、3组内容。前一个要素标注内容为换行符'n',后一个标注样式置空即可。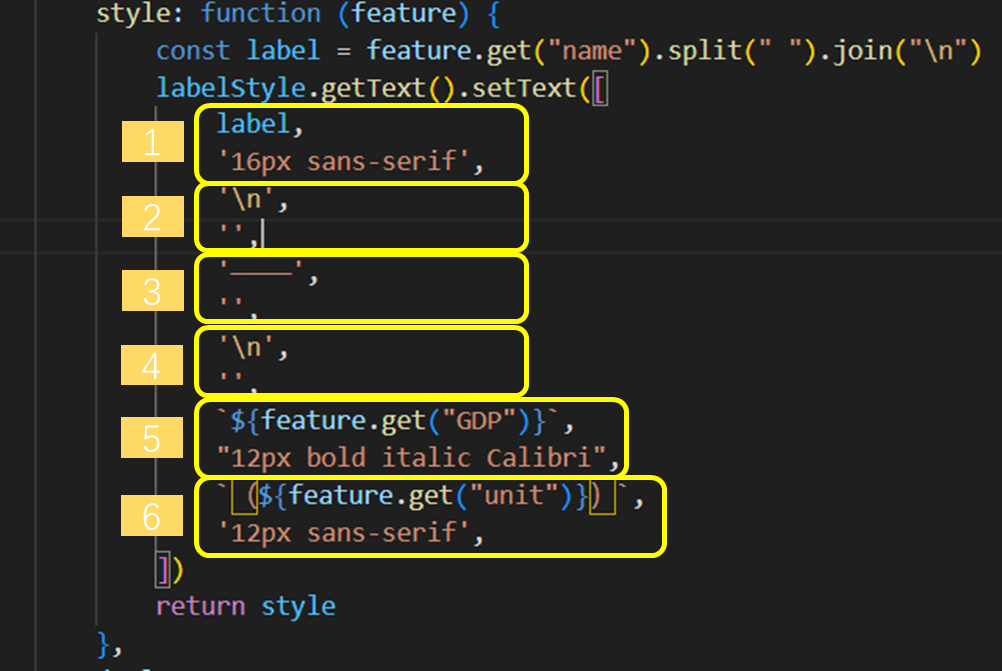
style: function (feature) {
    const label = feature.get("name").split(" ").join("n")
    labelStyle.getText().setText([
        label,
        '16px sans-serif',
        'n',
        '',
        '————',
        '',
        'n',
        '',
        `${feature.get("GDP")}`,
        "12px bold italic Calibri",
        `(${feature.get("unit")})`,
        '12px sans-serif',
    ])
    return style
},
4. 完整代码
其中libs文件夹下的包需要更换为自己下载的本地包或者引用在线资源。
<!DOCTYPE html>
<html>

<head>
    <meta http-equiv="Content-Type" content="text/html; charset=utf-8" />
    <title>OpenLayers 富文本标注</title>
    <meta charset="utf-8" />

    <link rel="stylesheet" href="../../libs/css/ol9.2.4.css">

    <script src="../../js/config.js"></script>
    <script src="../../libs/js/ol9.2.4.js"></script>
    <style>
        * {
            padding: 0;
            margin: 0;
            font-size: 14px;
            font-family: '微软雅黑';
        }

        html,
        body {
            width: 100%;
            height: 100%;
        }

        #map {
            position: absolute;
            top: 50px;
            bottom: 0;
            width: 100%;
        }

        #top-content {
            position: absolute;
            width: 100%;
            height: 50px;
            line-height: 50px;
            background: linear-gradient(135deg, #ff00cc, #ffcc00, #00ffcc, #ff0066);
            color: #fff;
            text-align: center;
            font-size: 32px;
        }

        #top-content span {
            font-size: 32px;
        }
    </style>
</head>

<body>
    <div id="top-content">
        <span>OpenLayers 富文本标注</span>
    </div>
    <div id="map" title=""></div>
</body>

</html>

<script>
    //地图投影坐标系
    const projection = ol.proj.get('EPSG:3857');
    //==============================================================================//
    //============================天地图服务参数简单介绍==============================//
    //================================vec:矢量图层==================================//
    //================================img:影像图层==================================//
    //================================cva:注记图层==================================//
    //======================其中:_c表示经纬度投影,_w表示球面墨卡托投影================//
    //==============================================================================//
    const TDTImgLayer = new ol.layer.Tile({
        title: "天地图影像图层",
        source: new ol.source.XYZ({
            url: "http://t0.tianditu.com/DataServer?T=img_w&x={x}&y={y}&l={z}&tk=" + TDTTOKEN,
            attibutions: "天地图影像描述",
            crossOrigin: "anoymous",
            wrapX: false
        })
    })
    const TDTImgCvaLayer = new ol.layer.Tile({
        title: "天地图影像注记图层",
        source: new ol.source.XYZ({
            url: "http://t0.tianditu.com/DataServer?T=cia_w&x={x}&y={y}&l={z}&tk=" + TDTTOKEN,
            attibutions: "天地图注记描述",
            crossOrigin: "anoymous",
            wrapX: false
        })
    })
    const map = new ol.Map({
        target: "map",
        loadTilesWhileInteracting: true,
        view: new ol.View({
            center: [102.845864, 25.421639],
            zoom: 8,
            worldsWrap: false,
            minZoom: 1,
            maxZoom: 20,
            projection: 'EPSG:4326',
        }),
        layers: [TDTImgLayer],
        // 地图默认控件
        controls: ol.control.defaults.defaults({
            zoom: false,
            attribution: true,
            rotate: true
        })
    })

    // 文本样式
    const labelStyle = new ol.style.Style({
        text: new ol.style.Text({
            font: '12px Calibri,sans-serif',
            overflow: true,
            // 填充色
            fill: new ol.style.Fill({
                color: "#FAFAD2"
            }),
            // 描边色
            stroke: new ol.style.Stroke({
                color: "#2F4F4F",
                width: 3,
            }),
        })
    })
    // 行政区样式
    const regionStyle = new ol.style.Style({
        fill: new ol.style.Fill({
            color: [230, 230, 250, 0.25],
        }),
        stroke: new ol.style.Stroke({
            color: "#00FFFF",
            width: 1.25,
        }),
    })

    // 标注样式数组
    const style = [labelStyle, regionStyle]

    // 行政区数据
    const JSON_URL = "../../data/geojson/yn_region.json"

    const layer = new ol.layer.Vector({
        source: new ol.source.Vector({
            url: JSON_URL,
            format: new ol.format.GeoJSON(),
        }),
        style: function (feature) {
            const label = feature.get("name").split(" ").join("n")
            labelStyle.getText().setText([
                label,
                '16px sans-serif',
                'n',
                '',
                '————',
                '',
                'n',
                '',
                `${feature.get("GDP")}`,
                "12px bold italic Calibri",
                `(${feature.get("unit")})`,
                '12px sans-serif',
            ])
            return style
        },
        declutter: true
    })
    map.addLayer(layer)
    map.getView().setCenter([101.485106, 25.008643])
    map.getView().setZoom(6.5)

</script>
❝
OpenLayers示例数据下载,请在公众号后台回复:ol数据
全国信息化工程师-GIS 应用水平考试资料,请在公众号后台回复:GIS考试
❝
GIS之路公众号已经接入了智能助手,欢迎大家前来提问。
欢迎访问我的博客网站-长谈GIS:
http://shanhaitalk.com
都看到这了,不要忘记点赞、收藏+关注 哦!
本号不定时更新有关 GIS开发 相关内容,欢迎关注 
