^ 关注我,带你一起学GIS ^
注:当前使用的是 ol [9.2.4] 版本,天地图使用的key请到天地图官网申请,并替换为自己的key
 前言
前言
❝图形绘制是指在地图上绘制点、线、面、圆、矩形等图形,可以通过鼠标单机绘制,也可以键盘按键配合进行绘制。图形绘制功能在
WebGIS开发中具有重要作用,通常用于要素查询、图形编辑以及图层分析功能。
1. 图形绘制原理
图形绘制通过与地图交互来完成,在地图单击事件中开始绘制对象,在地图移动事件中绘制临时对象,最后在地图双击事件或者鼠标右键事件中结束绘制。在OpenLayers中已经提供了一个绘制交互类供用户使用,我们利用ol.interaction.Draw绘制交互控件来完成几何对象的绘制
2. 创建绘制页面
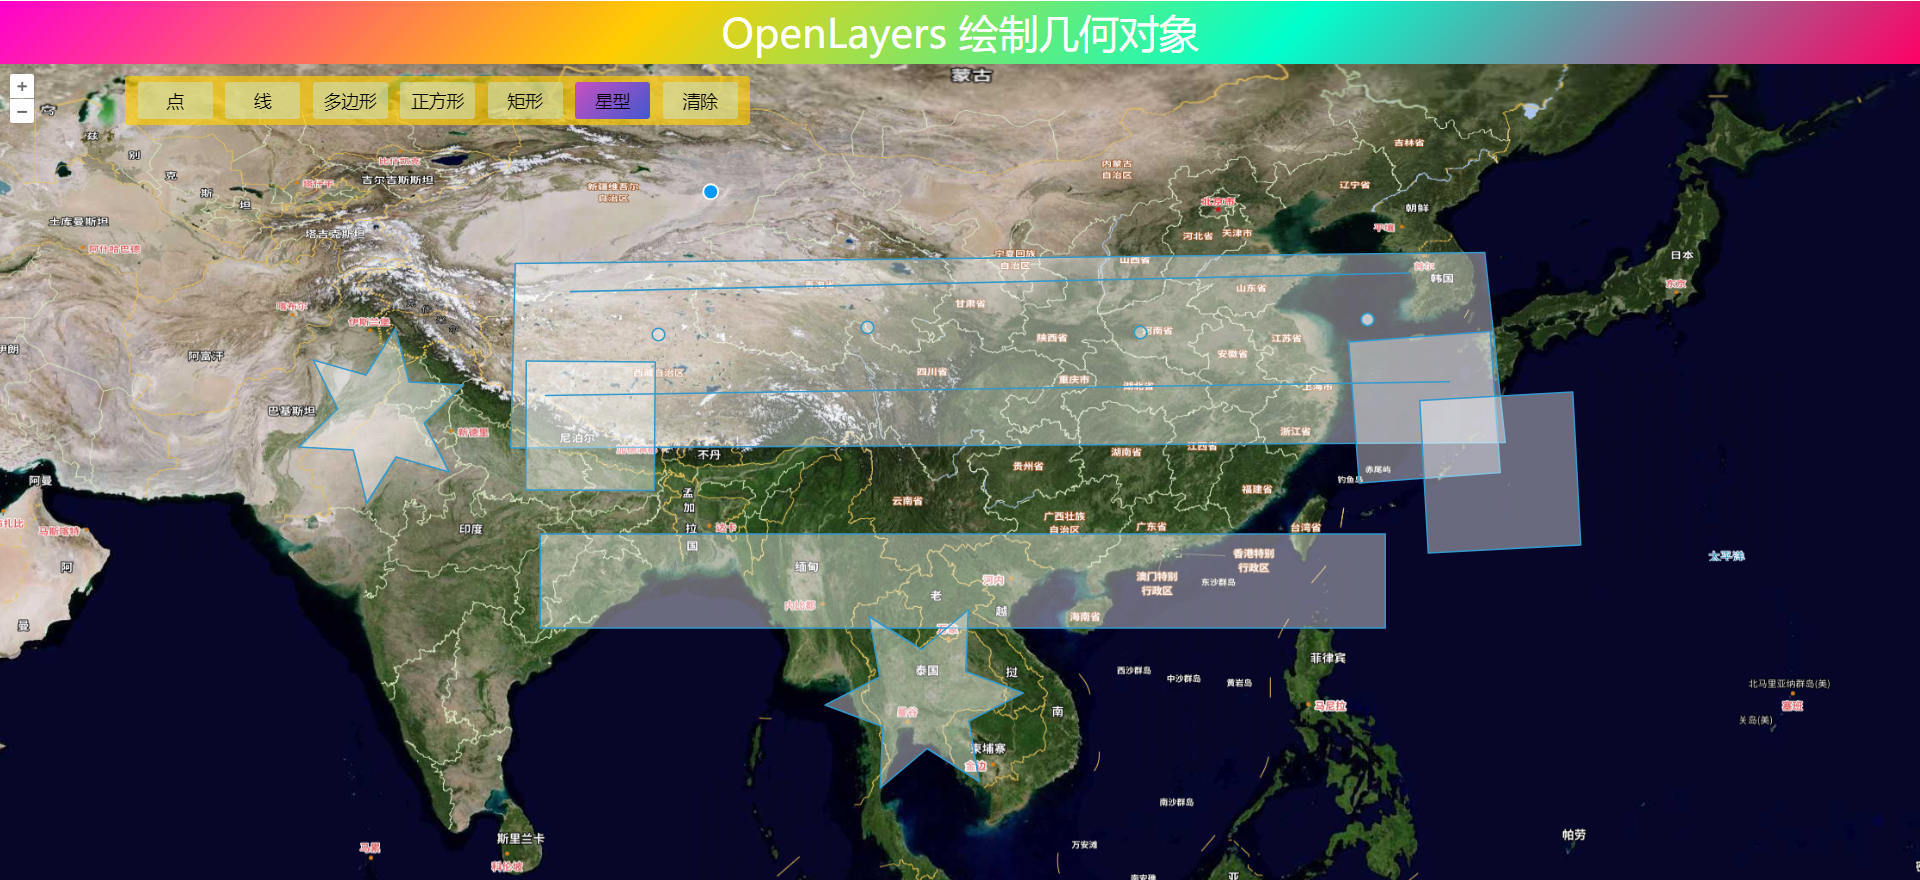
在页面中添加几何对象绘制内容,然后设置显示样式。利用元素data-type属性传递绘制对象类型。文中绘制的主要几何对象有点、线、多边形、正方形、矩形、星型,另外添加一个清除按钮用于移除交互控件和清除绘制结果。
.draw-shape {
    position: absolute;
    padding: 5px;
    top: 60px;
    left: 100px;
    background-color: #ffcc00ad;
    border-radius: 2.5px;
}

.draw-ul {
    list-style-type: none;
}

.draw-ul::after {
    display: block;
    clear: both;
    content: "";
}

.draw-li {
    float: left;
    padding: 5px;
    margin: 0 5px;
    min-width: 50px;
    background-color: azure;
    background: #cae4cf82;
    transition: background-color 10s ease-in-out 10s;
    text-align: center;
    border-radius: 2.5px;
}

.draw-li:hover {
    cursor: pointer;
    color: #fff;
    filter: brightness(120%);
    background: linear-gradient(135deg, #c850c0, #4158d0);
}

.active {
    background: linear-gradient(135deg, #c850c0, #4158d0);
}

<div class="draw-shape">
    <ul class="draw-ul">
        <li class="draw-li" data-type="Point">点</li>
        <li class="draw-li" data-type="LineString">线</li>
        <li class="draw-li" data-type="Square">正方形</li>
        <li class="draw-li" data-type="Box">矩形</li>
        <li class="draw-li" data-type="Star">星型</li>
        <li class="draw-li" data-type="None">清除</li>
    </ul>
</div>
3. 创建绘制对象
在绘制几何对象之前,需要提前创建好矢量数据源和矢量图层。因为绘制交互控件生产的几何对象需要转载在矢量数据源和矢量图层中。
const vectorSource = new ol.source.Vector({ wrapX: false })
const vectorLayer = new ol.layer.Vector({
    source: vectorSource
})
map.addLayer(vectorLayer)
添加一个绘制方法drawShape用来判断绘制几何对象。首先判断退出情况,即在type值为"None"时,移除交互控件和清除绘制对象,然后退出。对于像点、线、多边形这几个几何对象直接将数据源和类型值传入交互控件即可绘制,对于像正方形、矩形以及其他的一些特殊图形(自定义图形)需要使用geometryFunction参数进行修改。geometryFunction参数是一个函数,在绘制的几何对象坐标更新时会调用此函数。
function drawShape(type) {
  if (type === "None") {
      removeInteraction()
      // 清除图形
      vectorSource.clear()
      removeAllActiveClass(".draw-ul", "active")
      return
  }
  let geometryFunction = null
  switch (type) {
      case "Square":
          type = "Circle"
          geometryFunction = ol.interaction.Draw.createRegularPolygon(4)
          break
      case "Box":
          type = "Circle"
          geometryFunction = ol.interaction.Draw.createBox()
          break
      case "Star":
          type = "Circle"
          geometryFunction = function (coordinates, geometry) {
              const center = coordinates[0]
              const last = coordinates[coordinates.length - 1]
              const dx = center[0] - last[0]
              const dy = center[1] - last[1]
              const radius = Math.sqrt(dx * dx + dy * dy)

              const rotation = Math.atan2(dy, dx)
              const newCoordinates = []
              const numPoints = 12
              for (let i = 0; i < numPoints; ++i) {
                  const angle = rotation + (i * 2 * Math.PI) / numPoints
                  const fraction = i % 2 === 0 ? 1 : 0.5;
                  const offsetX = radius * fraction * Math.cos(angle)
                  const offsetY = radius * fraction * Math.sin(angle)
                  newCoordinates.push([center[0] + offsetX, center[1] + offsetY]);
              }
              newCoordinates.push(newCoordinates[0].slice());
              if (!geometry) {
                  geometry = new ol.geom.Polygon([newCoordinates])
              } else {
                  geometry.setCoordinates([newCoordinates])
              }
              return geometry
          }
          break
  }
  drawInteraction = new ol.interaction.Draw({
      source: vectorSource,
      type,
      geometryFunction
  })
  map.addInteraction(drawInteraction)
}
4. 添加绘制事件
在处理按钮事件时可以采用事件委托机制,有利于减少代码数量,使得结构更加简洁,也就不用为每个按钮单独添加一个处理事件了。
// 事件委托
const targetEle = document.querySelector(".draw-ul")
targetEle.addEventListener('click', evt => {
    removeInteraction()
    const targetEle = evt.target
    const geomType = targetEle.dataset.type
    if (geomType !== "None") {
        toogleAciveClass(targetEle, ".draw-ul")
    }
    if (geomType) {
        drawShape(geomType)
    }
})
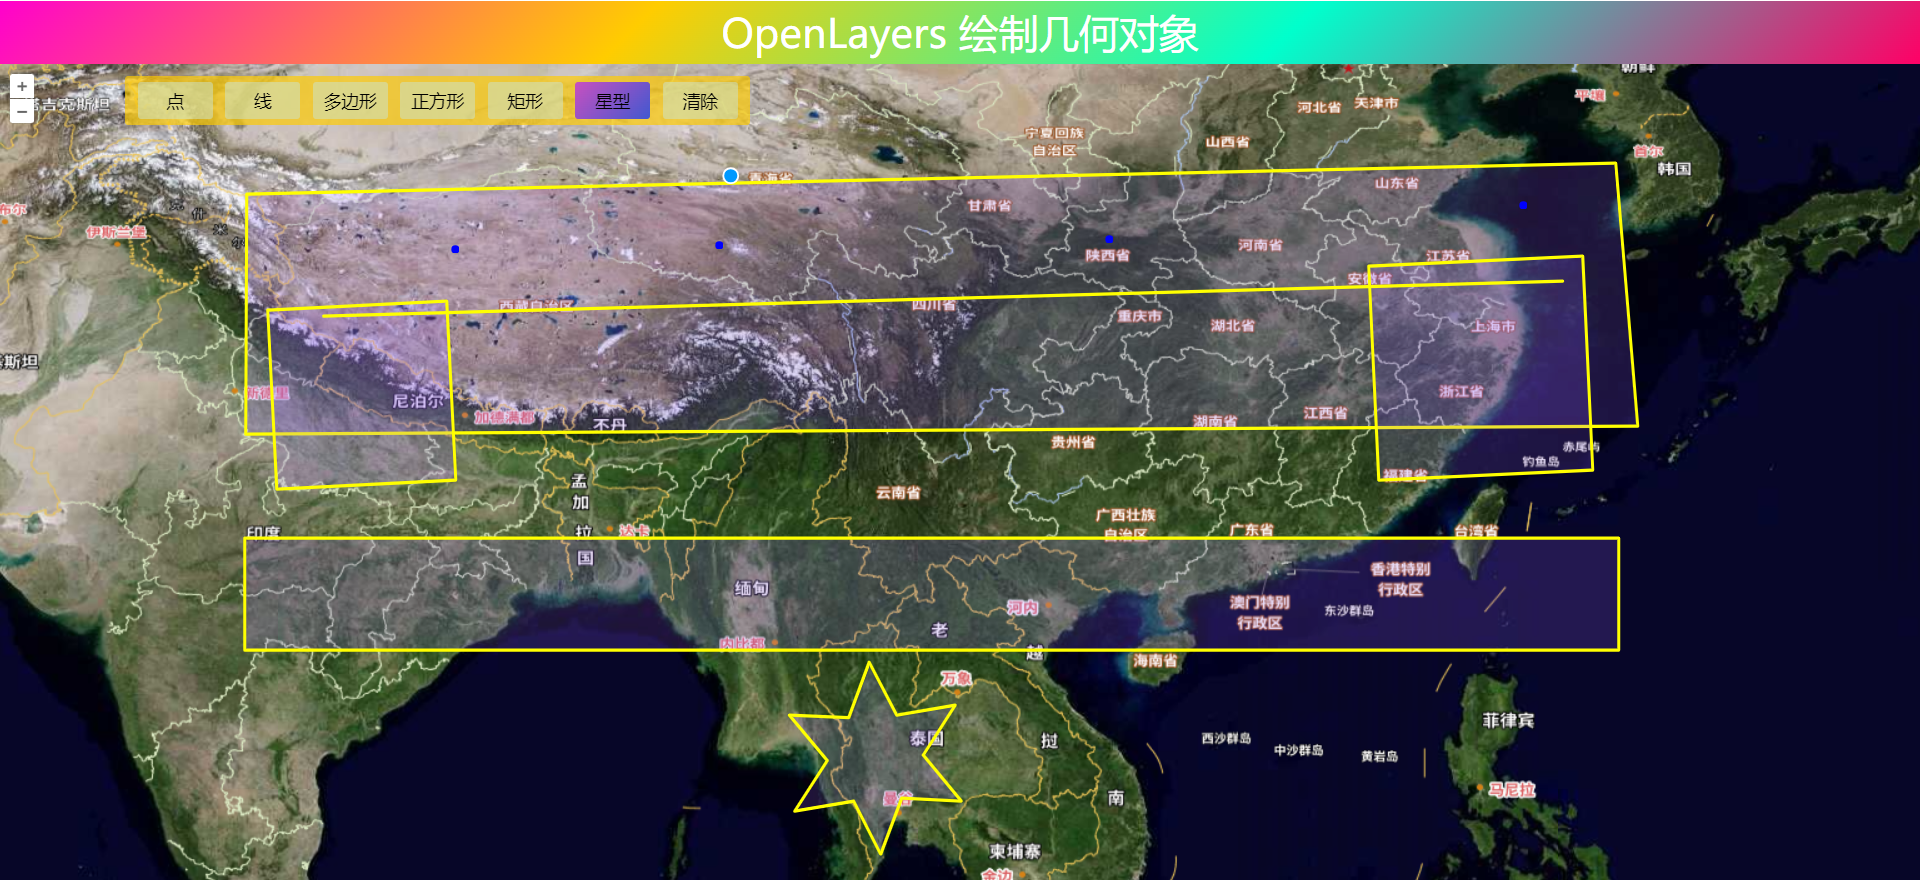
5. 修改绘制样式
经过以上步骤,已经可以绘制出几何对象了,但是目前使用的是默认图层样式,可能你会需要修改绘制的线段或者面的填充样式,那么应该怎样修改样式了?对于绘制的几何对象样式修改有两个地方可以进行修改,一个是放置数据源的矢量图层,另一个是绘制控件。矢量图层中的样式用于最终展示,即在几何对象绘制完成添加到地图上的显示效果;而绘制控件用于在绘制过程中显示绘制样式。
默认样式
修改图层样式
6. 自由绘制模式
在Draw交互对象中有一个属性freehand,可以开启自由绘制模式(我自称)。这是一个布尔类型,值为true时进行连续绘制,值为false时反之。 Operate in freehand mode for lines, polygons, and circles. This makes the interaction always operate in freehand mode and takes precedence over any freehandCondition option.百度翻译为徒手模式,我感觉不是很贴切,所以称之为自由绘制模式。有两种方式可以开启只有绘制模式,一种是显示设置
freehand属性值为true,之后使用鼠标单击直接绘制;另一种是按住shift键,然后鼠标单击进行绘制。在OpenLayers中,除了Point和MultiPoint之外的几何对象均可以开启自由绘制模式。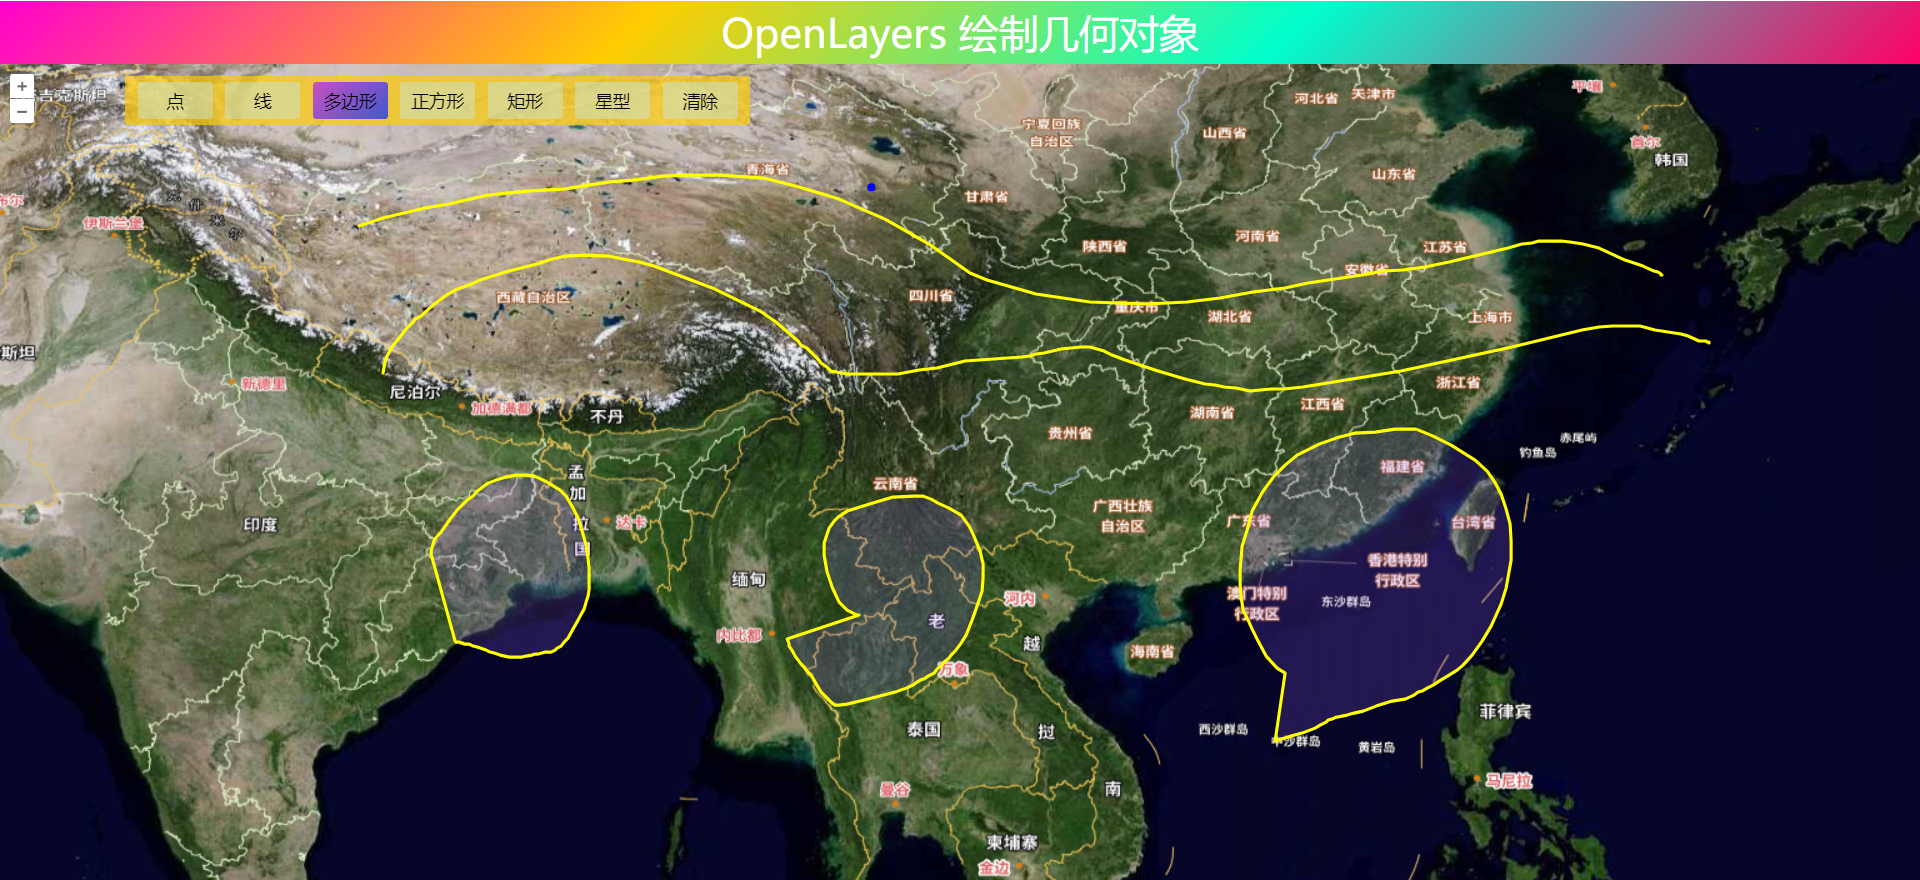
7. 完整代码
其中libs文件夹下的包需要更换为自己下载的本地包或者引用在线资源。
<!DOCTYPE html>
<html>

<head>
    <meta http-equiv="Content-Type" content="text/html; charset=utf-8" />
    <title>OpenLayers 绘制几何对象</title>
    <meta charset="utf-8" />

    <link rel="stylesheet" href="../../libs/css/ol9.2.4.css">

    <script src="../../js/config.js"></script>
    <script src="../../js/util.js"></script>
    <script src="../../libs/js/ol9.2.4.js"></script>
    <style>
        * {
            padding: 0;
            margin: 0;
            font-size: 14px;
            font-family: '微软雅黑';
        }

        html,
        body {
            width: 100%;
            height: 100%;
        }

        #map {
            position: absolute;
            top: 50px;
            bottom: 0;
            width: 100%;
        }

        #top-content {
            position: absolute;
            width: 100%;
            height: 50px;
            line-height: 50px;
            background: linear-gradient(135deg, #ff00cc, #ffcc00, #00ffcc, #ff0066);
            color: #fff;
            text-align: center;
            font-size: 32px;
        }

        #top-content span {
            font-size: 32px;
        }

        .draw-shape {
            position: absolute;
            padding: 5px;
            top: 60px;
            left: 100px;
            background-color: #ffcc00ad;
            border-radius: 2.5px;
        }

        .draw-ul {
            list-style-type: none;
        }

        .draw-ul::after {
            display: block;
            clear: both;
            content: "";
        }

        .draw-li {
            float: left;
            padding: 5px;
            margin: 0 5px;
            min-width: 50px;
            background-color: azure;
            background: #cae4cf82;
            transition: background-color 10s ease-in-out 10s;
            text-align: center;
            border-radius: 2.5px;
        }

        .draw-li:hover {
            cursor: pointer;
            color: #fff;
            filter: brightness(120%);
            background: linear-gradient(135deg, #c850c0, #4158d0);
        }

        .active {
            background: linear-gradient(135deg, #c850c0, #4158d0);
        }
    </style>
</head>

<body>
    <div id="top-content">
        <span>OpenLayers 绘制几何对象</span>
    </div>
    <div id="map" title="地图显示"></div>
    <div class="draw-shape">
        <ul class="draw-ul">
            <li class="draw-li" data-type="Point">点</li>
            <li class="draw-li" data-type="LineString">线</li>
            <li class="draw-li" data-type="Polygon">多边形</li>
            <li class="draw-li" data-type="Square">正方形</li>
            <li class="draw-li" data-type="Box">矩形</li>
            <li class="draw-li" data-type="Star">星型</li>
            <li class="draw-li" data-type="None">清除</li>
        </ul>
    </div>
</body>

</html>

<script>
    //地图投影坐标系
    const projection = ol.proj.get('EPSG:3857');
    //==============================================================================//
    //============================天地图服务参数简单介绍==============================//
    //================================vec:矢量图层==================================//
    //================================img:影像图层==================================//
    //================================cva:注记图层==================================//
    //======================其中:_c表示经纬度投影,_w表示球面墨卡托投影================//
    //==============================================================================//
    const TDTImgLayer = new ol.layer.Tile({
        title: "天地图影像图层",
        source: new ol.source.XYZ({
            url: "http://t0.tianditu.com/DataServer?T=img_w&x={x}&y={y}&l={z}&tk=" + TDTTOKEN,
            attibutions: "天地图影像描述",
            crossOrigin: "anoymous",
            wrapX: false
        })
    })
    const TDTImgCvaLayer = new ol.layer.Tile({
        title: "天地图影像注记图层",
        source: new ol.source.XYZ({
            url: "http://t0.tianditu.com/DataServer?T=cia_w&x={x}&y={y}&l={z}&tk=" + TDTTOKEN,
            attibutions: "天地图注记描述",
            crossOrigin: "anoymous",
            wrapX: false
        })
    })
    const map = new ol.Map({
        target: "map",
        loadTilesWhileInteracting: true,
        view: new ol.View({
            center: [102.845864, 25.421639],
            zoom: 5,
            worldsWrap: false,
            minZoom: 1,
            maxZoom: 20,
            projection: 'EPSG:4326',
        }),
        layers: [TDTImgLayer, TDTImgCvaLayer]
    })

    const style = new ol.style.Style({
        fill: new ol.style.Fill({
            color: "#9b65ff30"
        }),
        stroke: new ol.style.Stroke({
            color: "yellow",
            width: 2.5,
        }),
        image: new ol.style.Circle({
            fill: new ol.style.Fill({
                color: "blue"
            }),
            radius: 2.5,
            stroke: new ol.style.Stroke({
                color: "blue",
                width: 1.5,
            }),
        })
    })
    const vectorSource = new ol.source.Vector({ wrapX: false })
    const vectorLayer = new ol.layer.Vector({
        source: vectorSource,
        style
    })
    map.addLayer(vectorLayer)
    let drawInteraction = null
    /**
     * 根据几何类型绘制几何对象
     */
    function drawShape(type) {
        if (type === "None") {
            removeInteraction()
            // 清除图形
            vectorSource.clear()
            removeAllActiveClass(".draw-ul", "active")
            return
        }
        let geometryFunction = null
        switch (type) {
            case "Square":
                type = "Circle"
                geometryFunction = ol.interaction.Draw.createRegularPolygon(4)
                break
            case "Box":
                type = "Circle"
                geometryFunction = ol.interaction.Draw.createBox()
                break
            case "Star":
                type = "Circle"
                geometryFunction = function (coordinates, geometry) {
                    const center = coordinates[0]
                    const last = coordinates[coordinates.length - 1]
                    const dx = center[0] - last[0]
                    const dy = center[1] - last[1]
                    const radius = Math.sqrt(dx * dx + dy * dy)

                    const rotation = Math.atan2(dy, dx)
                    const newCoordinates = []
                    const numPoints = 12
                    for (let i = 0; i < numPoints; ++i) {
                        const angle = rotation + (i * 2 * Math.PI) / numPoints
                        const fraction = i % 2 === 0 ? 1 : 0.5;
                        const offsetX = radius * fraction * Math.cos(angle)
                        const offsetY = radius * fraction * Math.sin(angle)
                        newCoordinates.push([center[0] + offsetX, center[1] + offsetY]);
                    }
                    newCoordinates.push(newCoordinates[0].slice());
                    if (!geometry) {
                        geometry = new ol.geom.Polygon([newCoordinates])
                    } else {
                        geometry.setCoordinates([newCoordinates])
                    }
                    return geometry
                }
                break
        }
        drawInteraction = new ol.interaction.Draw({
            source: vectorSource,
            type,
            geometryFunction,
            style,
            // freehand: true // 是否开启自由绘制模式
        })
        map.addInteraction(drawInteraction)
    }

    // 事件委托
    const targetEle = document.querySelector(".draw-ul")
    targetEle.addEventListener('click', evt => {
        removeInteraction()
        const targetEle = evt.target
        const geomType = targetEle.dataset.type
        if (geomType !== "None") {
            toogleAciveClass(targetEle, ".draw-ul")
        }
        if (geomType) {
            drawShape(geomType)
        }
    })

    // 移除绘制控件
    function removeInteraction() {
        if (drawInteraction) {
            map.removeInteraction(drawInteraction)
        }
    }
</script>
❝
OpenLayers示例数据下载,请在公众号后台回复:ol数据
全国信息化工程师-GIS 应用水平考试资料,请在公众号后台回复:GIS考试
❝
GIS之路公众号已经接入了智能助手,欢迎大家前来提问。
欢迎访问我的博客网站-长谈GIS:
http://shanhaitalk.com
都看到这了,不要忘记点赞、收藏+关注 哦!
本号不定时更新有关 GIS开发 相关内容,欢迎关注 
