^ 关注我,带你一起学GIS ^
注:当前使用的是 ol [9.2.4] 版本,天地图使用的key请到天地图官网申请,并替换为自己的key
 前言
前言
对于像GeoJSON、KML等地理数据格式的文件,最常用的方法都是通过VectorLayer进行渲染。除此之外,还可以使用VectorImage(矢量影像图层)进行渲染。本文主要介绍在客户端拖动上传GeoJSON、KML等文件,并采用VectorImage方式渲染图层。
1. 矢量影像简介
矢量影像图层叫做VectorImage,采用这种方式加载图层的话,它会将矢量数据渲染为图像。使用VectorImage在平移和缩放过程中性能表现很好,但是点符号和文本会始终跟随视图旋转,并且像素在缩放过程中也会跟随动画缩放。官方推荐:为了更精确的渲染矢量数据,可以使用VectorLayer。
与矢量影像图层相同,还有一个VectorLayer,这是常用的矢量图层。使用VectorLayer会将矢量数据渲染为矢量形式,能够提供精确渲染功能。在旋转过程中,视图上的点和标签始终保持垂直。但是对于数据量非常大的矢量数据,平移和缩放动画的性能可能会有影响。官方推荐:此时可以使用VectorImage
2. 图层自定义属性
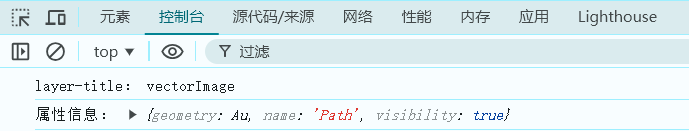
在图层配置选项中设置的任何自定义参数都会成为BaseObject对象的属性,意味着该自定义属性是可观察属性,并且具有get和set访问器。例如设置图层属性title: "vectorImage",此时可以通过get进行访问。
const vectorLayer = new ol.layer.VectorImage({
    title: "vectorImage",
    source: vectorSource,
    wrapX: false
})
console.log("layer-title:", vectorLayer.get("title"))
3. 创建地图交互控件
通过DragAndDrop创建地图交互控件,然后监听addfeatures事件,将文件数据添加到地图上并缩放到图层范围,使用formatConstructors属性设置上传文件类型,主要有GPX、GeoJSON、KML等格式。然后在Map对象中使用interactions属性添加默认交互控件,因为Interactions类不是DragAndDrop类的子类,所以需要使用extend继承DragAndDrop类。
// ol 交互控件
const dragAndDropInteraction = new ol.interaction.DragAndDrop({
    formatConstructors: [
        ol.format.GPX,
        ol.format.GeoJSON,
        ol.format.KML
    ]
})
// 地图交互控件
interactions: ol.interaction.defaults.defaults()
    .extend([dragAndDropInteraction])
4. 监听地图移动事件
在上传文件成功,将数据添加至地图上之后,监听地图鼠标移动事件pointermove,在地图事件中可以获取到鼠标位置像素坐标,再通过地图方法forEachFeatureAtPixel得到目标要素,并设置其样式和弹出信息窗口,在鼠标移出时恢复默认样式。
// 监听鼠标移动事件
map.on('pointermove', evt => {
    if (evt.dragging) {
        // 若正在拖动文件,则返回
        return
    }
    const featureOver = map.forEachFeatureAtPixel(evt.pixel, feature => {
        if (!feature) {
            return
        }
        // 设置选中样式
        feature.setStyle(new ol.style.Style({
            stroke: new ol.style.Stroke({
                color: "red",
                width: 2.5
            })
        }))
        // 信息窗口属性
        const property = feature.getProperties()
        const position = map.getCoordinateFromPixel(evt.pixel)
        openPopupTable(property, popupColumns, position)
        return feature;
    })
    if (targetFeature && targetFeature !== featureOver) {
        // 恢复默认样式
        targetFeature.setStyle(defaultStyle)
    }
    targetFeature = featureOver
})
5. 完整代码
其中libs文件夹下的包需要更换为自己下载的本地包或者引用在线资源。
<!DOCTYPE html>
<html>

<head>
    <meta http-equiv="Content-Type" content="text/html; charset=utf-8" />
    <title>OpenLayers 渲染矢量影像</title>
    <meta charset="utf-8" />

    <link rel="stylesheet" href="../../libs/css/ol9.2.4.css">
    <link rel="stylesheet" href="../../css/popup.css">

    <script src="../../js/config.js"></script>
    <script src="../../js/util.js"></script>
    <script src="../../js/popup.js"></script>

    <script src="../../libs/js/ol9.2.4.js"></script>
    <script src="../../libs/js/jszip.min.js"></script>
    <script src="../../libs/js/shapefile.min.js"></script>
    <style>
        * {
            padding: 0;
            margin: 0;
            font-size: 14px;
            font-family: '微软雅黑';
        }

        html,
        body {
            width: 100%;
            height: 100%;
        }

        #map {
            position: absolute;
            top: 50px;
            bottom: 0;
            width: 100%;
        }

        #top-content {
            position: absolute;
            width: 100%;
            height: 50px;
            line-height: 50px;
            background: linear-gradient(135deg, #ff00cc, #ffcc00, #00ffcc, #ff0066);
            color: #fff;
            text-align: center;
            font-size: 32px;
        }

        #top-content span {
            font-size: 32px;
        }
    </style>
</head>

<body>
    <div id="top-content">
        <span>OpenLayers 渲染矢量影像</span>
    </div>
    <div id="map" title="地图显示"></div>
</body>

</html>

<script>
    //地图投影坐标系
    const projection = ol.proj.get('EPSG:3857');
    //==============================================================================//
    //============================天地图服务参数简单介绍==============================//
    //================================vec:矢量图层==================================//
    //================================img:影像图层==================================//
    //================================cva:注记图层==================================//
    //======================其中:_c表示经纬度投影,_w表示球面墨卡托投影================//
    //==============================================================================//
    const TDTImgLayer = new ol.layer.Tile({
        title: "天地图影像图层",
        source: new ol.source.XYZ({
            url: "http://t0.tianditu.com/DataServer?T=img_w&x={x}&y={y}&l={z}&tk=" + TDTTOKEN,
            attibutions: "天地图影像描述",
            crossOrigin: "anoymous",
            wrapX: false
        })
    })
    const TDTImgCvaLayer = new ol.layer.Tile({
        title: "天地图影像注记图层",
        source: new ol.source.XYZ({
            url: "http://t0.tianditu.com/DataServer?T=cia_w&x={x}&y={y}&l={z}&tk=" + TDTTOKEN,
            attibutions: "天地图注记描述",
            crossOrigin: "anoymous",
            wrapX: false
        })
    })

    // ol 交互控件
    const dragAndDropInteraction = new ol.interaction.DragAndDrop({
        formatConstructors: [
            ol.format.GPX,
            ol.format.GeoJSON,
            ol.format.KML
        ]
    })
    const map = new ol.Map({
        target: "map",
        loadTilesWhileInteracting: true,
        view: new ol.View({
            center: [102.845864, 25.421639],
            zoom: 6.5,
            worldsWrap: false,
            minZoom: 1,
            maxZoom: 20,
            projection: 'EPSG:4326',
        }),
        layers: [TDTImgLayer],
        // 地图默认控件
        controls: ol.control.defaults.defaults({
            zoom: false,
            attribution: false,
            rotate: false
        }),
        // 地图交互控件
        interactions: ol.interaction.defaults.defaults()
            .extend([dragAndDropInteraction])
    })

    map.on('click', evt => {
        console.log("获取地图坐标:", evt.coordinate)
    })

    let defaultStyle = undefined
    function setInteraction() {
        if (dragAndDropInteraction) {
            map.removeInteraction(dragAndDropInteraction)
        }
        // 监听要素事件
        dragAndDropInteraction.on('addfeatures', evt => {
            const vectorSource = new ol.source.Vector({
                features: evt.features,
                wrapX: false
            })
            const vectorLayer = new ol.layer.VectorImage({
                source: vectorSource,
                wrapX: false
            })
            defaultStyle = vectorLayer.getStyle()
            map.addLayer(vectorLayer)
            map.getView().fit(vectorSource.getExtent())
        })
        map.addInteraction(dragAndDropInteraction)
    }
    setInteraction()

    // 展示属性信息
    const popupColumns = [
        { name: "name", comment: "名称" }
    ]
    let targetFeature = undefined
    map.on('pointermove', evt => {
        if (evt.dragging) {
            // 若正在拖动文件,则返回
            return
        }
        const featureOver = map.forEachFeatureAtPixel(evt.pixel, feature => {
            if (!feature) {
                return
            }
            feature.setStyle(new ol.style.Style({
                stroke: new ol.style.Stroke({
                    color: "red",
                    width: 2.5
                })
            }))
            const property = feature.getProperties()
            // console.log("属性信息:", property)
            const position = map.getCoordinateFromPixel(evt.pixel)
            openPopupTable(property, popupColumns, position)
            return feature;
        })
        if (targetFeature && targetFeature !== featureOver) {
            targetFeature.setStyle(defaultStyle)
        }
        targetFeature = featureOver
    })
</script>
❝
OpenLayers示例数据下载,请在公众号后台回复:ol数据
全国信息化工程师-GIS 应用水平考试资料,请在公众号后台回复:GIS考试
❝
GIS之路公众号已经接入了智能助手,欢迎大家前来提问。
欢迎访问我的博客网站-长谈GIS:
http://shanhaitalk.com
都看到这了,不要忘记点赞、收藏+关注 哦!
本号不定时更新有关 GIS开发 相关内容,欢迎关注 
