^ 关注我,带你一起学GIS ^
注:当前使用的是 ol [9.2.4] 版本,天地图使用的key请到天地图官网申请,并替换为自己的key
 前言
前言
❝在
OpenLayers中,使用Style样式类进行图形渲染,除了填充属性fill、描边属性stroke等之外,还可以使用hitDetectionRenderer属性自定义渲染样式,通过hitDetectionRenderer属性,可以设置检测目标对象的样式。
1. hitDetectionRenderer属性
hitDetectionRenderer作为Style对象的一个属性,和renderer属性一样,也是RenderFunction类型,也就是一个渲染函数。这个方法具有两个参数:
coordinates:GeoJSON格式的Geometry对象像素值坐标。State:图层渲染器状态对象。
2. hitDetectionRenderer渲染
使用hitDetectionRenderer之前封装一个Feature要素渲染方法。canvas绘制方法请参:“把啦啦啦啦啦啦啦”
const fillStyle = "rgba(255,255,200,0.22)"
const renderFeature = (ctx, coordinates, fillStyle) => {
    ctx.fillStyle = fillStyle
    ctx.strokeStyle = "red"
    ctx.beginPath()
    coordinates[0][0].forEach((coords, index) => {
        index === 0 ? ctx.moveTo(coords[0], coords[1]) : ctx.lineTo(coords[0], coords[1])
    })
    ctx.closePath();
    ctx.fill()
    ctx.stroke()
}
遍历图形象数坐标,然后通过调用canvas方法moveTo和lineTo进行绘制并进行渲染。一般**Feature**对象属性geometry类型为Polygon,为三层数组结构,在遍历时使用coordinates[0]即可,但是例子中使用的GeoJSON数据**Feature**对象属性geometry类型都是**MultiPolygon**,为四层数组结构,所以在遍历坐标数组时需要使用coordinates[0][0]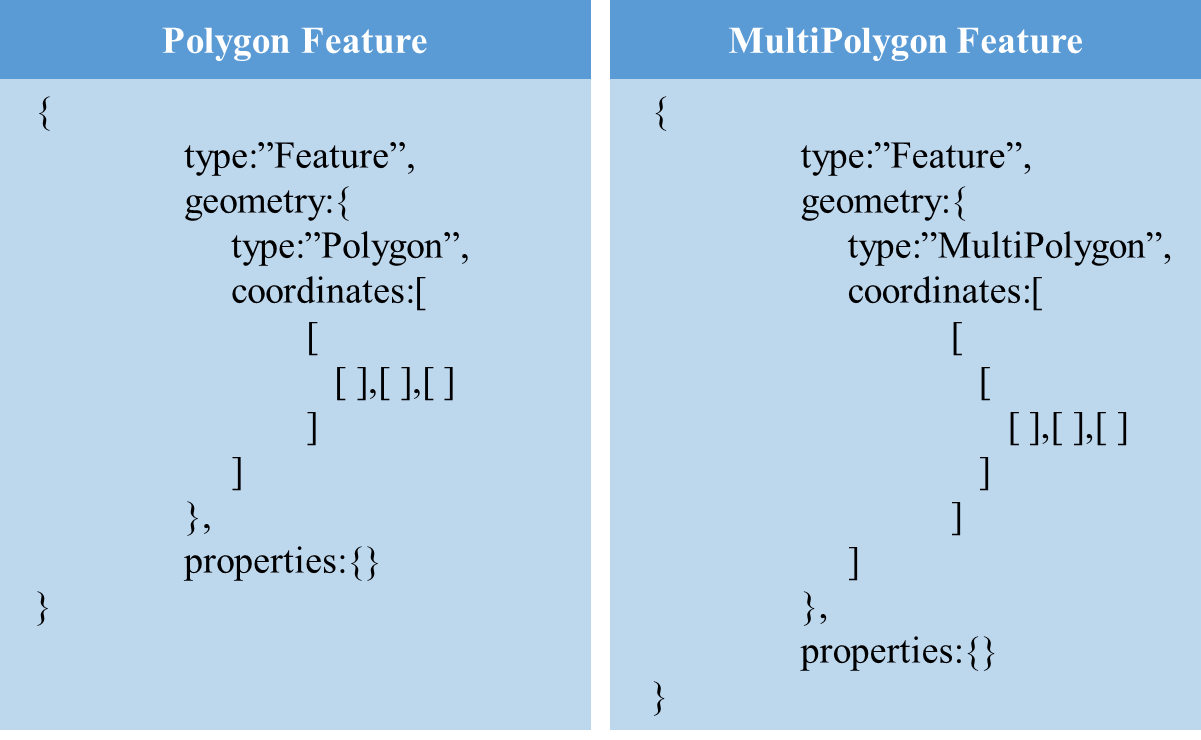 在本例中,在使用
hitDetectionRenderer之前,先遍历GeoJSON要素集features,将GeoJSON要素feature通过readFeature方法转换为ol要素对象Feature。再利用set方法设置自定义样式属性,最后利用renderer方法进行渲染,而在hitDetectionRenderer函数中,当检测目标存在时,则通过get('fill-color')获取要素样式进行渲染。
const layer = new ol.layer.Vector({
    source: new ol.source.Vector({
        format: new ol.format.GeoJSON(),
        features: new ol.Collection(
            features.map(item => {
                // 将GeoJSON数据转换为ol Feature要素
                const feature = (new ol.format.GeoJSON()).readFeature(item)
                const properties = feature.getProperties()
                const label = properties.name.split(" ").join("n")
                // 通过set方法设置自定义属性'fill-color'
                feature.set('fill-color', fillStyle)
                feature.setStyle(new ol.style.Style({
                    // 通过renderer函数渲染Feature
                    renderer(coordinates, state) {
                        const ctx = state.context
                        renderFeature(ctx, coordinates, state.feature.get('fill-color'))
                    },
                    // 设置目标Feature Style
                    hitDetectionRenderer(coordinates, state) {
                        const ctx = state.context
                        const feature = state.feature
                        renderFeature(ctx, coordinates, state.feature.get('fill-color'))
                    }
                }))
                return feature
            })
        )
    }),
    declutter: true
})
3. 鼠标移动检测目标要素
监听地图鼠标移动事件pointermove,通过forEachFeatureAtPixel方法获取鼠标移动位置像素坐标对应的Feature对象。在检测到目标要素时,设置目标对象填充样式,利用getTargetElement方法获取地图对象绑定的HTML元素,从而改变指针样式,同时打开信息弹窗显示目标对象属性信息。
map.on("pointermove", evt => {
    const featureOver = map.forEachFeatureAtPixel(evt.pixel, (feature) => {
        feature.set('fill-color', 'rgba(255,255,180,0.8)');
        map.getTargetElement().style.cursor = "pointer"
        const position = feature.getProperties().center
        // 显示属性信息
        openPopupTable(feature.getProperties(), popupColumns, position)
        return feature;
    })
    if (pointerOverFeature && pointerOverFeature !== featureOver) {
        pointerOverFeature.set('fill-color', fillStyle);
        map.getTargetElement().style.cursor = "default"
    }
    pointerOverFeature = featureOver
})
4. 信息弹窗Popup代码及样式
Popup JS
/**
 * 封装Popup表格内容,显示属性信息
 * @properties:要素属性信息
 * @popupColumns:字段配置:如[{fieldName:province,commnet:"省"},{fieldName:region,comment:"行政区"}]
 * @position: popup 定位坐标,形式为 [longitude,latitude]
 */
function openPopupTable(property, popupColumns, position) {
    removeOverlayByName("overLay")
    const parentDiv = document.createElement("div")
    parentDiv.className = "popup-parent"
    const headDiv = document.createElement("div")
    headDiv.className = "popup-title"
    headDiv.innerHTML = "<span class='popup-title-span'>属性信息</span><span class='popup-title-close'>x</span>"

    parentDiv.appendChild(headDiv)
    const tableEle = document.createElement('table')
    const tbodyEle = document.createElement('tbody')
    tableEle.appendChild(tbodyEle)
    tableEle.className = "popup-table"
    tableEle.setAttribute('border', '1')
    tableEle.setAttribute('cellpadding', '0')
    tableEle.setAttribute('cellspacing', '0')

    Object.values(popupColumns).forEach((prop, index) => {
        // 过滤无效属性字段
        if (prop["name"] === 'id' || prop["name"] === 'oid') return
        const trEle = document.createElement('tr')
        trEle.className = 'table-tr'
        const firstTdEle = document.createElement('td')
        const secondTdEle = document.createElement('td')
        firstTdEle.innerText = popupColumns[index].comment
        secondTdEle.innerText = property[popupColumns[index].name] || '暂无'

        trEle.appendChild(firstTdEle)
        trEle.appendChild(secondTdEle)
        tbodyEle.appendChild(trEle)
    })
    parentDiv.appendChild(tableEle)
    // 创建Overlay popup
    const overlay = new ol.Overlay({
        id: "temp-",
        position: position,
        element: parentDiv,
        offset: [0, 20], // x、y轴偏移量,正值向右向下,负值相反
        autoPan: false,
        autoPanMargin: 1.25,
        positioning: 'top-center' // 定位方式,顶部居中
    })
    overlay.setProperties({ layerName: "overLay" })
    map.addOverlay(overlay)
}
Popup CSS
/**
 * openLayers Popup信息弹窗样式
 */
.popup-parent {
    position: relative;
    z-index: 9999;
}

.popup-title {
    display: flex;
    justify-content: space-between;
    padding: 5px;
    background: #007f65;
    border-top-left-radius: 5px;
    border-top-right-radius: 5px;
}

.popup-title-span {
    line-height: 30px;
    width: 50%;
}

.popup-title-close {
    margin-right: 10px;
    font-size: 16px;
    color: #ccc;
    width: 30px;
    height: 30px;
    text-align: center;
    line-height: 30px;
}

.popup-title-close:hover {
    cursor: pointer;
    color: #c9fef9;
    border-radius: 50%;
    background-color: #348e69cc;
    transition: all .25s;
}

.ol-overlay-container p {
    margin: 5px 0 !important;
}

.ol-overlay-container {
    padding: 2px;
    max-height: 300px;
    color: #fff;
    border-radius: 2px;
}

.popup-analyse-btn {
    width: 100%;
    background-color: rgb(219, 197, 137);
    padding: 10px;
    border-radius: 2.5px;
    margin-top: 10px;
    display: inline-block;
    color: #fffefe;
    border-color: #fff;
    text-align: center;
}

.popup-analyse-btn:hover {
    cursor: pointer;
    color: #fff;
    filter: brightness(110%) opacity(100%);
    transition: all .5s ease-in;
    background: linear-gradient(to bottom right, #9a99f1, #0167cc);
}

.popup-analyse-btn:focus {
    filter: brightness(120%);
    transition: all .5s ease-in;
    background: radial-gradient(circle at center, #9a99f1, #0167cc);
}

.popup-table {
    background: #1a423394;
    border: 1px solid #d9d9d9ad;
    border-collapse: collapse;
}

.table-tr {
    width: 100%;
}

.table-tr:hover {
    cursor: pointer;
    background-color: #0c698d61;
}

.table-tr td {
    padding: 10px 5px;
    line-height: 1.5;
}

.table-tr td:first-child {
    text-align: right;
    width: 45%;
}

.table-tr td:last-child {
    text-align: left;
    width: 55%;
}
5. 完整代码
其中libs文件夹下的包需要更换为自己下载的本地包或者引用在线资源。
<!DOCTYPE html>
<html>

<head>
    <meta http-equiv="Content-Type" content="text/html; charset=utf-8" />
    <title>OpenLayers Style属性hitDetectionRenderer</title>
    <meta charset="utf-8" />

    <link rel="stylesheet" href="../../libs/css/ol9.2.4.css">
    <link rel="stylesheet" href="../../css/popup.css">

    <script src="../../js/config.js"></script>
    <script src="../../js/popup.js"></script>
    <script src="../../js/util.js"></script>
    <script src="../../libs/js/ol9.2.4.js"></script>
    <style>
        * {
            padding: 0;
            margin: 0;
            font-size: 14px;
            font-family: '微软雅黑';
        }

        html,
        body {
            width: 100%;
            height: 100%;
        }

        #map {
            position: absolute;
            top: 50px;
            bottom: 0;
            width: 100%;
        }

        #top-content {
            position: absolute;
            width: 100%;
            height: 50px;
            line-height: 50px;
            background: linear-gradient(135deg, #ff00cc, #ffcc00, #00ffcc, #ff0066);
            color: #fff;
            text-align: center;
            font-size: 32px;
        }

        #top-content span {
            font-size: 32px;
        }

        #layer-container {
            position: absolute;
            top: 15%;
            left: 20px;
            width: 30%;
            bottom: 5%;
            background: #fff;
            color: #fff;
            border: 1px solid #ddd;
            border-radius: 2.5px;
        }
    </style>
</head>

<body>
    <div id="top-content">
        <span>OpenLayers Style属性hitDetectionRenderer</span>
    </div>
    <div id="map" title="地图显示"></div>
</body>
</html>

<script>
    //地图投影坐标系
    const projection = ol.proj.get('EPSG:3857');
    //==============================================================================//
    //============================天地图服务参数简单介绍==============================//
    //================================vec:矢量图层==================================//
    //================================img:影像图层==================================//
    //================================cva:注记图层==================================//
    //======================其中:_c表示经纬度投影,_w表示球面墨卡托投影================//
    //==============================================================================//
    const TDTImgLayer = new ol.layer.Tile({
        title: "天地图影像图层",
        source: new ol.source.XYZ({
            url: "http://t0.tianditu.com/DataServer?T=img_w&x={x}&y={y}&l={z}&tk=" + TDTTOKEN,
            attibutions: "天地图影像描述",
            crossOrigin: "anoymous",
            wrapX: false
        })
    })
    const TDTImgCvaLayer = new ol.layer.Tile({
        title: "天地图影像注记图层",
        source: new ol.source.XYZ({
            url: "http://t0.tianditu.com/DataServer?T=cia_w&x={x}&y={y}&l={z}&tk=" + TDTTOKEN,
            attibutions: "天地图注记描述",
            crossOrigin: "anoymous",
            wrapX: false
        })
    })
    const map = new ol.Map({
        target: "map",
        loadTilesWhileInteracting: true,
        view: new ol.View({
            center: [102.845864, 25.421639],
            zoom: 8,
            worldsWrap: false,
            minZoom: 1,
            maxZoom: 20,
            projection: 'EPSG:4326',
        }),
        layers: [TDTImgLayer],
        // 地图默认控件
        controls: ol.control.defaults.defaults({
            zoom: false,
            attribution: false,
            rotate: false
        })
    })

    const fillStyle = "rgba(255,255,200,0.22)"
    const renderFeature = (ctx, coordinates, fillStyle) => {
        ctx.fillStyle = fillStyle
        ctx.strokeStyle = "red"
        ctx.beginPath()
        coordinates[0][0].forEach((coords, index) => {
            index === 0 ? ctx.moveTo(coords[0], coords[1]) : ctx.lineTo(coords[0], coords[1])
        })
        ctx.closePath();
        ctx.fill()
        ctx.stroke()
    }

    const JSON_URL = "https://geo.datav.aliyun.com/areas_v3/bound/530000_full.json"
    const strokeStyle = "red"
    fetch(JSON_URL)
        .then(response => response.json())
        .then(result => {
            console.log(result)
            const features = result.features
            const layer = new ol.layer.Vector({
                source: new ol.source.Vector({
                    format: new ol.format.GeoJSON(),
                    features: new ol.Collection(
                        features.map(item => {
                            const feature = (new ol.format.GeoJSON()).readFeature(item)
                            const properties = feature.getProperties()
                            const label = properties.name.split(" ").join("n")
                            feature.set('fill-color', fillStyle)
                            feature.setStyle(new ol.style.Style({
                                renderer(coordinates, state) {
                                    const ctx = state.context
                                    renderFeature(ctx, coordinates, state.feature.get('fill-color'))
                                },
                                hitDetectionRenderer(coordinates, state) {
                                    const ctx = state.context
                                    const feature = state.feature
                                    renderFeature(ctx, coordinates, state.feature.get('fill-color'))
                                }
                            }))
                            return feature
                        })
                    )
                }),
                declutter: true
            })
            map.addLayer(layer)
            map.getView().setCenter([101.485106, 25.008643])
            map.getView().setZoom(6.5)
        })
    let pointerOverFeature = undefined
    const popupColumns = [
        { comment: "行政区代码", name: "adcode" },
        { comment: "行政区名称", name: "name" },
        { comment: "行政区级别", name: "level" },
        { comment: "中心点", name: "center" },
        { comment: "中心点id", name: "centroid" },

    ]
    map.on("pointermove", evt => {
        const featureOver = map.forEachFeatureAtPixel(evt.pixel, (feature) => {
            feature.set('fill-color', 'rgba(255,255,180,0.8)');
            map.getTargetElement().style.cursor = "pointer"
            const position = feature.getProperties().center
            openPopupTable(feature.getProperties(), popupColumns, position)
            return feature;
        })
        if (pointerOverFeature && pointerOverFeature !== featureOver) {
            pointerOverFeature.set('fill-color', fillStyle);
            map.getTargetElement().style.cursor = "default"
        }
        pointerOverFeature = featureOver
    })
</script>
❝
OpenLayers示例数据下载,请在公众号后台回复:ol数据
全国信息化工程师-GIS 应用水平考试资料,请在公众号后台回复:GIS考试
❝
GIS之路公众号已经接入了智能助手,欢迎大家前来提问。
欢迎访问我的博客网站-长谈GIS:
http://shanhaitalk.com
都看到这了,不要忘记点赞、收藏+关注 哦!
本号不定时更新有关 GIS开发 相关内容,欢迎关注 
